APP REPORT
App Report, Store & Ranking Data
Keep up with updates, stay ahead of the competition, expand globally and make informed decisions to optimize your app strategies.

Health & fitness
Category
App Store
Store
Apr 29, 2024
Last Updated
Calm.com
Publisher
Visibility Score
Category Ranking History
Review Breakdown
Ad Intelligence on 4 Networks

Preview
| Media Type | Video |
| Ad Networks |  3+ |
| First Seen | 6 days ago |
| Last Seen | 6 days ago |
Aso Keywords
Keyword
meditation app free
calm
calming
sleep meditation
calm app
Rank
1
2
3
4
5
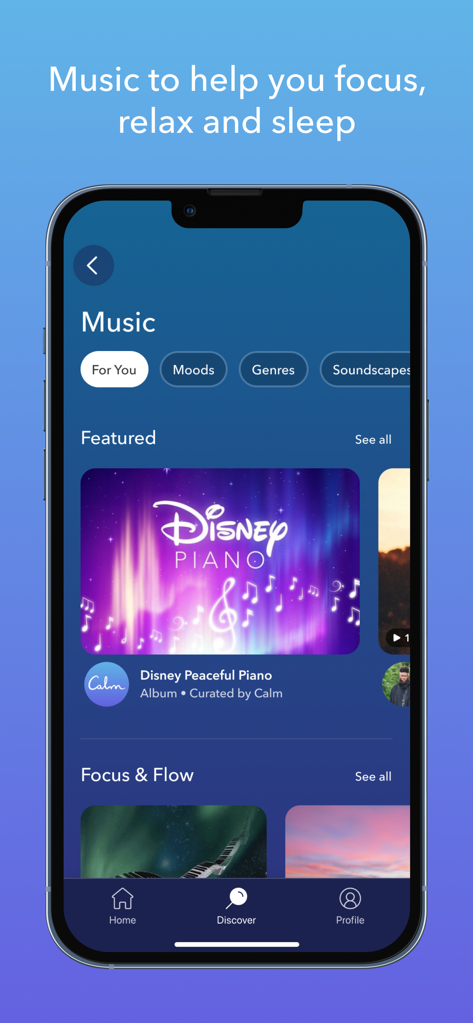
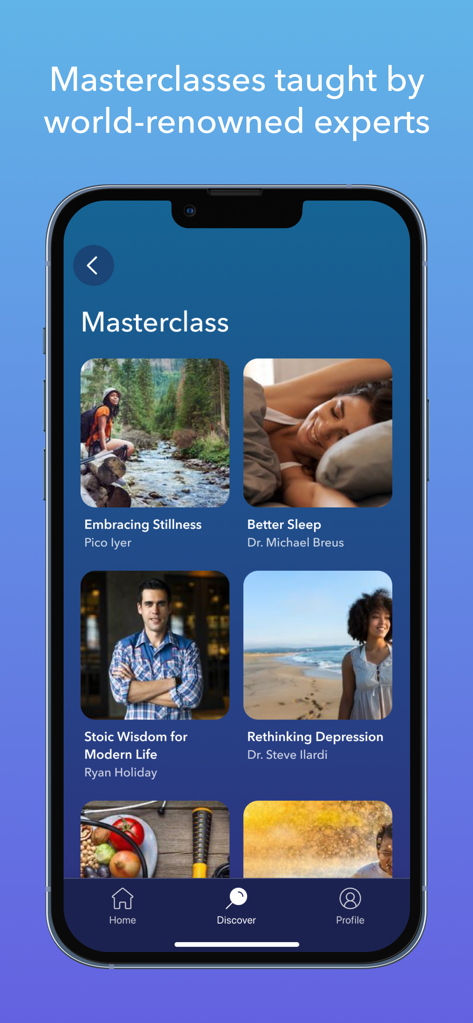
Screenshots

Preview

Preview

Preview

Preview
Preview
Preview
Description
** 2017 App of the Year ** — Apple
** Happiest App in the World ** — Center for Humane Technology
Calm is the #1 app for Sleep, Meditation and Relaxation. Sleep better, relieve stress, lower anxiety and refocus your attention. Explore an extensive library of guided meditations, Sleep Stories, breathwork, exclusive music and stretching exercises.
Invest in your mental health and choose a guided meditation session that fits within your busy schedule. Add Calm to your daily routine and join the millions experiencing the life-changing benefits of practicing mindfulness. Beginners, intermediate and advanced users can all find their home in Calm.
Let relaxing music and calming sounds help you meditate, focus and sleep better. Sleep Stories are bedtime stories that are guaranteed to lull you into a deep and restful slumber. Pick from 100+ exclusive Sleep Stories, featuring well-known talent such as Matthew McConaughey, Stephen Fry, Rosé, Jerome Flynn and P!nk.
Calm is recommended by top psychologists, therapists and mental health experts. Take a deep breath and find your Calm.
CALM FEATURES
MEDITATION & MINDFULNESS
* Meditate with seasoned experts, regardless of your experience level
* Introduce mindfulness into your daily routine and learn to calm your mind
* Mindfulness topics include Deep Sleep, Calming Anxiety, Managing Stress, Focus and Concentration, Breaking Habits, Happiness, Self-Esteem and so much more
SLEEP STORIES
* Sleep soundly listening to bedtime stories for adults and children alike
* Wonder - Join Matthew McConaughey on a dreamy story about the mysteries of the universe
* Blue Gold - Journey through the sleepy village of Provence with master storyteller Stephen Fry
* The Nordland Night Train - Travel up the scenic coast of Norway aboard a remote railway
* Happy Little Zzzs - Drift off to the soothing brush strokes of beloved painter Bob Ross
RELAXATION & STRESS RELIEF
* Learn to relax and lower stress with daily meditation and breathing exercises
* Focus on a goal with Dailies - Reduce anxiety with daily 10-minute original programs like the Daily Calm with Tamara Levitt, the Daily Trip with Jeff Warren, or the Daily Jay with Jay Shetty
* Shift your thinking and find your calm through inspiring stories with Wisdom
* Daily Move: Mindful stretching and movement to relax your body during the day
ALSO FEATURING
* Daily Streaks & Mindful Minutes: Track and celebrate your progress
* 7 and 21 day mindfulness programs for both beginner and advanced users
* Music: Exclusive music engineered to help you focus, relax or sleep
* Soundscapes to sleep: Ocean waves, Heavy Rain, Camp Fire, Babbling Brook and more
Calm saves your meditation and sleep sessions to your Apple Health app.
Subscription pricing and terms:
Calm offers an auto-renewing monthly subscription at $14.99/month and an auto-renewing yearly subscription at $69.99/year to provide you with unlimited access to the Calm Collection while you maintain an active subscription. Calm also offers a Lifetime subscription for $399.99 which is paid for by a one-off upfront payment with unlimited access to the Calm Collection forever.
Payment will be charged to the credit card connected to your iTunes Account when you confirm the initial subscription purchase. Subscriptions automatically renew unless auto-renew is turned off at least 24-hours before the end of the current subscription period. Your account will be charged for renewal within 24-hours prior to the end of the current period, and the cost of the renewal will be identified. You may manage your subscription and auto-renewal may be turned off by going to your Account Settings after the purchase. Any unused portion of a free trial period, if offered, will be forfeited when you purchase a subscription, where applicable.
Read more about our terms and conditions here:
Terms of service: https://www.calm.com/terms
Privacy policy: https://www.calm.com/privacy
Reviews
Amazing!
alphaleopard207on2024-04-15
Currently im struggling a lot mentally, i almost got sent to an in-patient mental hospital. I now have to take counseling and just waking up in the morning fills me with dread to the point i sometimes just sleep the whole day away… and would often feel to sick and nauseated by stress and anxiety that i would not eat most of the day if at all
But the meditation on this app rlly helps, at the end of the day i have my relax time, where i do some of the exercises meant to relieve stress or anxiety and i just try to forget about the world for a little bit to enjoy my last few hours of peaceful quiet for the day. It also helps me calm down enough to eat my food and keep it down. It really really helps, and it also has helped me fall asleep when my mind would usually be running. Its making this hard time a little more bearable, and if you have some stress or anxiety weighting on you, i very much suggest this app for you!
Disappointing Experience: False Promises and Poor Customer Service
La Morena787on2024-04-25
If I could rate this app zero stars, I definitely would. My journey with Calm has been everything but serene. Initially, I was drawn in by the promise of a free trial, only to find myself bombarded with limitations soon after. Despite opting for another 7-day trial as advertised, I was charged a whopping $76.20 immediately.
To make matters worse, 16 days into using the app, I found myself locked out of premium features despite having paid for them. Attempts to restore purchases were futile, leaving me feeling cheated and stuck with a pricey app that's essentially unusable.
Seeking recourse, I turned to Apple for a refund, only to be met with unhelpful responses and denials, pushing me back to the app developer, who have yet to respond.
In short, my excitement for Calm quickly turned to disappointment. Save yourself the trouble and steer clear of this app.
Too gamified & cluttered now
KikiTheCruzon2024-04-15
Love the sleep stories. Bought a lifetime subscription 5 years ago. They just won’t stop fiddling with the interface, though, and I’m less and less satisfied. When I wake up in the middle of the night, I just want to pick another story: I don’t want to be confronted with my “streak,” I don’t want to be told to take a bath before bedtime, I don’t want to run through all the choices on the app (which are legion). Gamifying meditation and sleep does not make for a calm experience—it makes it more stressful! And in the middle of night case—harder to use and counterproductive! The devs are so bent on getting users to try every new feature on the app (selling data?) that they’re failing to use common sense. Just let us arrange out own home screens and block out the features we don’t want or use. Please!
I don’t like that a lot of apps now have Subscriptions
lovingorcaon2024-04-21
I don’t like that a lot of apps now have Subscriptions. Even apps that you have to buy first. Then they have subscriptions. The cost of living has gone up and so has corporate greed. Food cost more. Diet plays a big part in our health. We have to eat healthy in order for our bodies to function properly. 1. physical health comes first. When a person eats healthy they feel better. We need proper nutrition in order to maintain good health. 2nd. our mental health. This app can be good. I also like VR which is a 360 view that makes you feel like you’re really there. Meta Quest headsets. Calm could make an app for the Meta Quest headset and make it so that the person can use it offline. 1.A Beach scene. 2. Car ride. FirePlace. To name a few.
Some medications are good
KB2024KBon2024-04-26
I’m super picky about the voices of those providing guided sleep meditation. I wish there was less from Tamara Levitt which seems to be the majority. Voices I have found soothing are Jerome Flynn, Megan Reitz, Chibs Okereke, Dr. Lopez and Kirat Randawa. But there are only a couple from each of those. For the kids meditation, my child is also super in tune with what they like and prefers the meditations done in the character voices… Like the Paw Patrol and Minions. If you’re a faithful user of the sleep meditations as we are, it starts to get old when you find there are only certain ones you listen to over and over again. I would like the ability to rate those meditations provided and offer feedback.
Good product with nonexistent support
Zestylemontreeon2024-04-20
I bought a lifetime subscription in 2019. One week ago, I updated my phone for the first time in those 5 years. I was suddenly locked out of Calm premium (though my account history still showed all the thousands of hours of listening I’ve done).
I’m stuck in an endless loop of generic, unrelated macros with their “support” team who seems unempowered to actually help. It’s been 8 days, and based on the emails I’ve gotten, I don’t think anyone has actually read my requests or looked at my account.
I depend on Calm for sleep; their product is amazing, but this horrible, stressful experience with their support team will make me use a different service just as soon as I find one.
Best app ever!
iDadx4on2024-04-23
This app I have been using for ever! It is my #1 recommendation for help to sleep and calm down from life stress etc, I can now choose from a variety of stories meditations and mornin workouts! I got this app when I started having deep thoughts and my Alexa stories weren’t working and I would wouldn’t sleep well at night. This app is and always will be #1 because, this app like I said has stories, meditations, exercises, and other things like sleep tracking, mood checking,
user use, and sooooooooo much more hope you respond and never give up on this app
Yous truly, ??? Unknown
Great app for every day stress not for urgent needs
Elven Jedion2024-04-18
This app is great for managing and even preventing every day stress with its guided meditations and focus music, but when major struggles like a panic attack or anxiety happen you are given other advice like “try searching instead for gratitude”. Of course the app isn’t meant for an emergency situation but when you are feeling alone and not knowing what else to do, turning to an app that usually helps is something you might think to try. I hope the developers might think to include terms like this for when you can’t think to look up “breathing” or other terms while in a stressed state.
Horrible, ad ridden experience
Nethicon2024-04-26
This app is completely littered with advertisements. They frequently upsell you.
Open the app? Get shown advertisement for premium service.
Finish a timed meditation? Get shown advertisement for premium service.
For an app that is designed to put people in a better headspace, harassing users with advertisements for a premium service at every turn is a frustrating, and stressful experience.
Just finished a peaceful meditation, feeling relaxed? Here’s an ad for you, buy our premium service. Welcome back to the real world, a-hole.
Terrible app. Would give 0 stars if I could.
Nothing about it is good
torentosanon2024-04-22
I saw the advertisement and signed up. First use I was disappointed and every use after that. So much so I cancelled my subscription. Wish I could have gotten my money back for this overpriced app. With a week left on my subscription I’m going to delete the app because it’s such a waste of effort to even find anything in it worth using. $14.99 lesson that of there’s not a free trial then it’s too risky to trust the advertisement. Originally I signed up for a year, but luckily I cancelled right after trying it.