Every app developer is familiar with the fluctuations of downloads over the week. They can be frustrating when performing ASO and measuring its impacts. However, if treated carefully, changes across days can turn the tides by giving valuable insights about user behavior.
The most basic and well-known observation is, downloads on average increases 30% for the weekends. But, there are more insights we can uncover for app developers thanks to thousands of apps connected to our platform.
While diving into this quest, a couple of intriguing questions we asked to ourselves were:
- How we can create a weekly profile of download distribution?
- How user behaviour changes across categories in terms of daily downloads?
To tackle these questions, we have analyzed hundreds of thousands observations from App Store apps connected to MobileAction platform and found out how the download numbers of each category distributes to the days of the week.
We used the real data from integrated apps to MobileAction Dashboard, so that these are not estimates but what is really happening in the App Store.
The resulting chart of all categories was an extremely crowded one so that it is not a good chart to give information about specific app categories, however it really confirms the overall trend of download behavior in App Store distributed to a whole week:
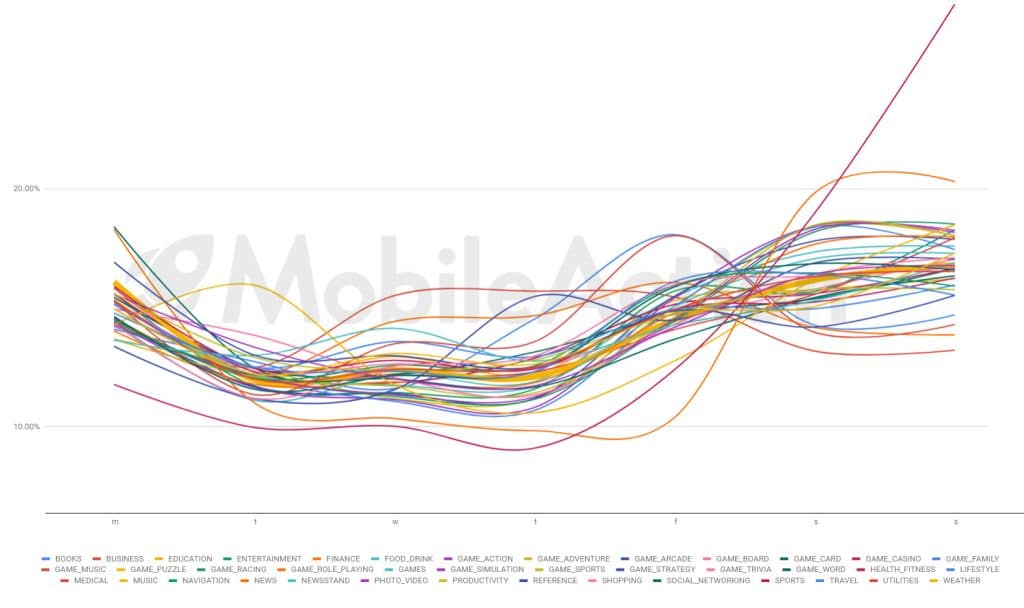
Depending on this chart, it’s safe to say that there is a slight decrease in the downloading in all categories towards the middle of the week, specifically from Tuesday until Thursday, and it gets back into the mean values around Friday again. Weekends are the most active days for almost all categories except several ones. We will touch upon them later on.
Recommended Article:
How about My Category?
At this point, you’re more than right to ask that how is the daily distribution of downloads for your category. We thought so! Let’s carry on with some surprising insights about specific categories’ download distributions.
Among all the categories; we cannot see a remarkable increase in Business, Finance, Medical and Books apps’ downloads in the weekends. This might be due to the weekday related activity inherent in these categories’ apps.
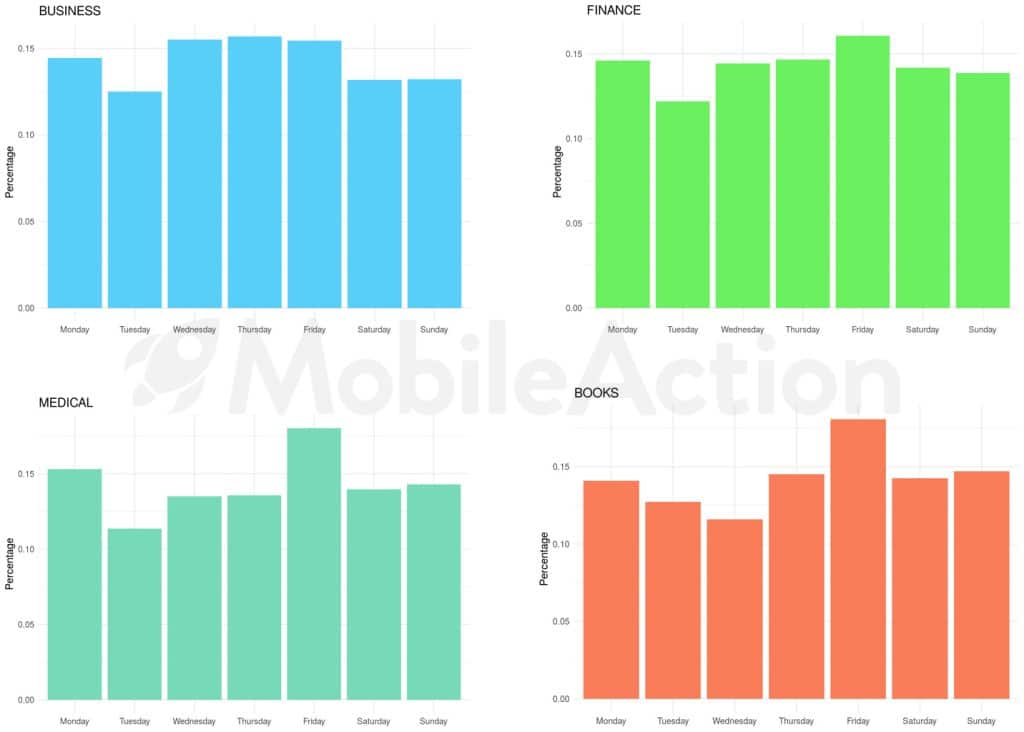
One other insight we can infer from these charts is that there is a certain spike in the downloads of Finance, Medical and Books apps in Friday. This might be due to the an end-of-the-week last check on Business & Finance apps just before the markets are closed for the weekend.
Sports category exhibited one of the most interesting patterns we witnessed among our data. Depending on a one-month period (specifically between January and February 2019) Sports apps are downloaded almost 60% more on Sundays compared to the rest of the week.
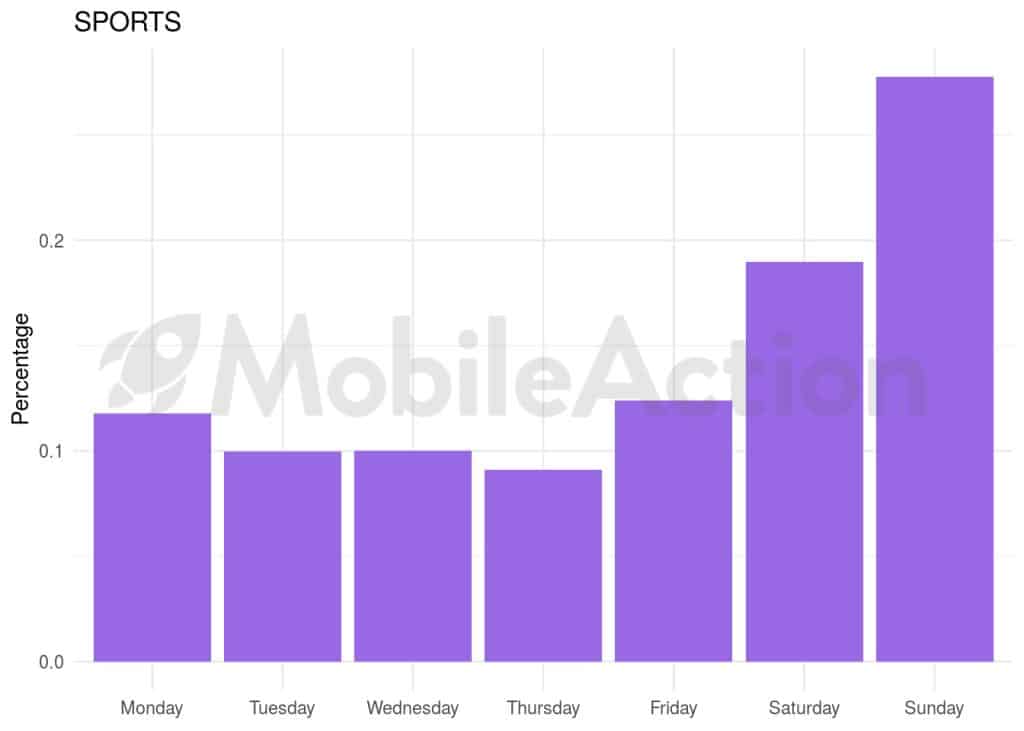
Even though this might be a biased data due to the NFL’s and Super Bowl’s seasonal influences, it’s still clear thar Sports apps are definitely on the weekend bucket list for a fair amount of mobile users.
Games?
What is generally accepted in the games, which is they are played mostly on weekends, holds true according to our data. However, in a few categories, the weekly distributions offer some interesting insights.
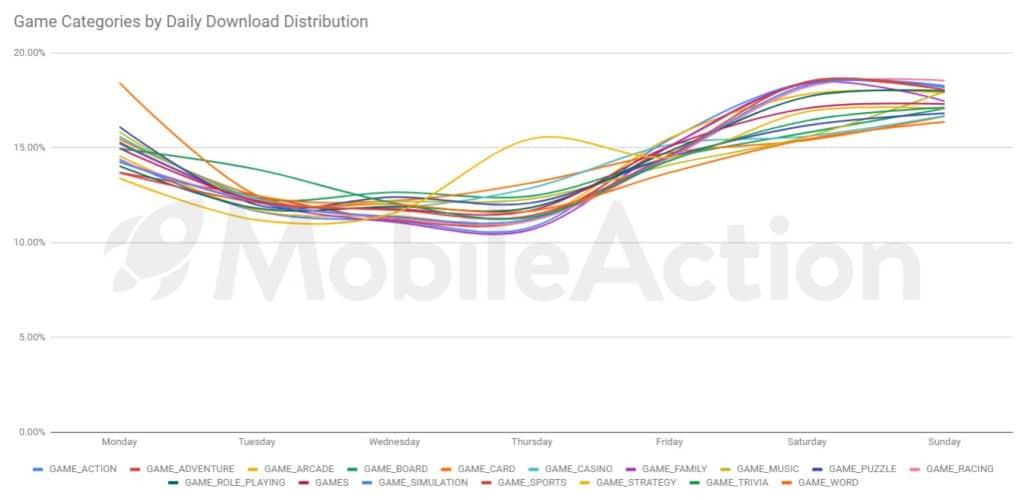
In the chart above, we see that the daily download distributions of different game categories mostly fit in the general trend. However, we can still see that there are certain spikes in some of them. Here we list these as:
- Word games are downloaded more on Mondays compared to other types.
- Strategy games have a spike on Thursdays with over 15% of downloads of the whole week.
Fluctuations
Based on the data we have, it’s also possible to come up with a weekly fluctuation pattern for each category. Depending on the difference between minimum and maximum distributions of download among days, we listed down the most fluctuating 10 categories in terms of downloads.
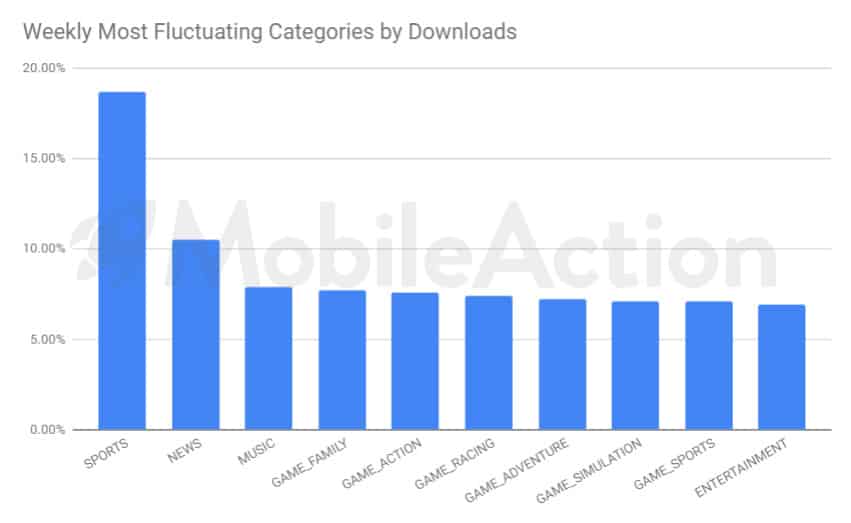
It’s not a surprise for us to witness that most of the fluctuation occurs in the Games. This is a significant insight for game publishers about planning their marketing and advertising efforts in the scope of a week. The next and final section of this post suggests some useful ways these insights can be leveraged by publishers.
How can you use these insights?
What we have so far is a daily download distribution of each category in the Apple’s App Store during a week. This certainly offers a pattern for the marketing and advertising efforts for your app, in which you can plan for more impressions on the days your category is active.
If you’re a game developer, for example, it becomes much wiser to run ads on weekends or focus your user acquisition strategies on these days. Especially for channels like Apple Search Ads, this becomes a significant insight for planning impressions.
Our suggestion is for you to create your own app download profile and compare it with the category benchmark of your app. You might use a bar-chart visualization for this purpose, like the one in the following:
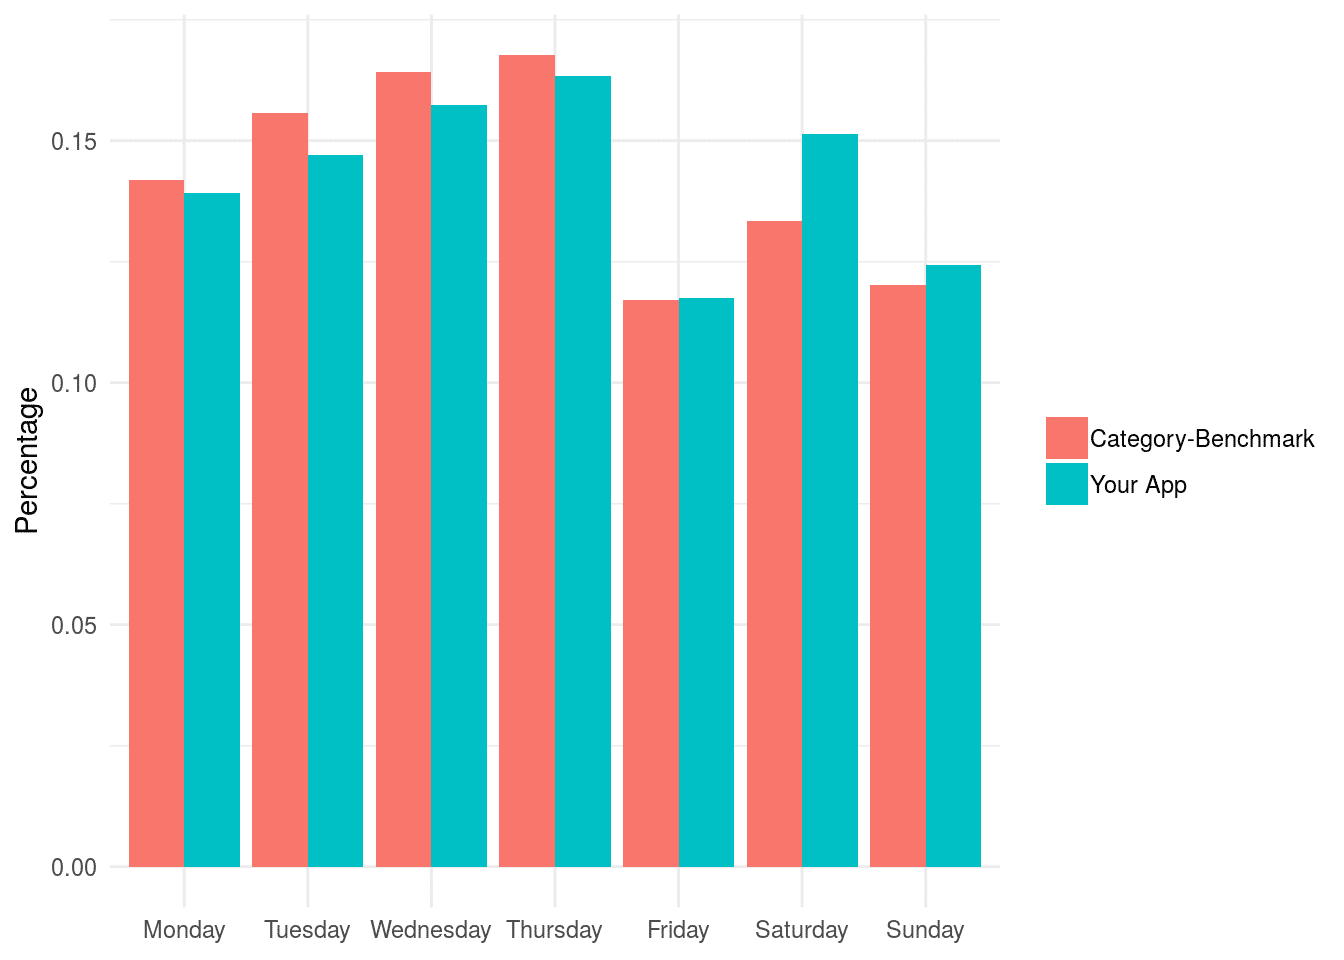
By utilizing such a chart, you can also measure the performance of your app about how it fits into your categories’ benchmark and what can be improved about it.
However, if you’re thinking about how to continuously leverage that benchmark data, we have good news for you!
On MobileAction Dashboard, we’re currently working on the implementation of this and several other benchmarking sections to help you better understand your position and performance in the market.
Integrate your app to our dashboard now, and we’ll keep you updated about all the process.
Guess what? It’s completely free to integrate your app to MobileAction Dashboard and get Sales & Download metrics along a couple of Recommended Actions. Stay tuned, more is on the way!
We wish you a happier UA process and better planning with these daily insights!
Cheers,
MobileAction Team