


Looking to boost your app's visibility and acquire more users? Our 2025 ASO Report is your ultimate guide to navigating the evolving app store landscape. Packed with data-driven insights, keyword trends, and top-ranking app strategies, this report will equip you with the knowledge to optimize your app's presence and achieve organic growth.
Mobile Action continues to provide deep insights about the app ecosystem. We recently shared a detailed report about weekly impression, product page visit and install behaviour of App Store users in Japan.
This analysis was done over 2500 apps that are active in Japan. Key takeaways can be listed as follows:
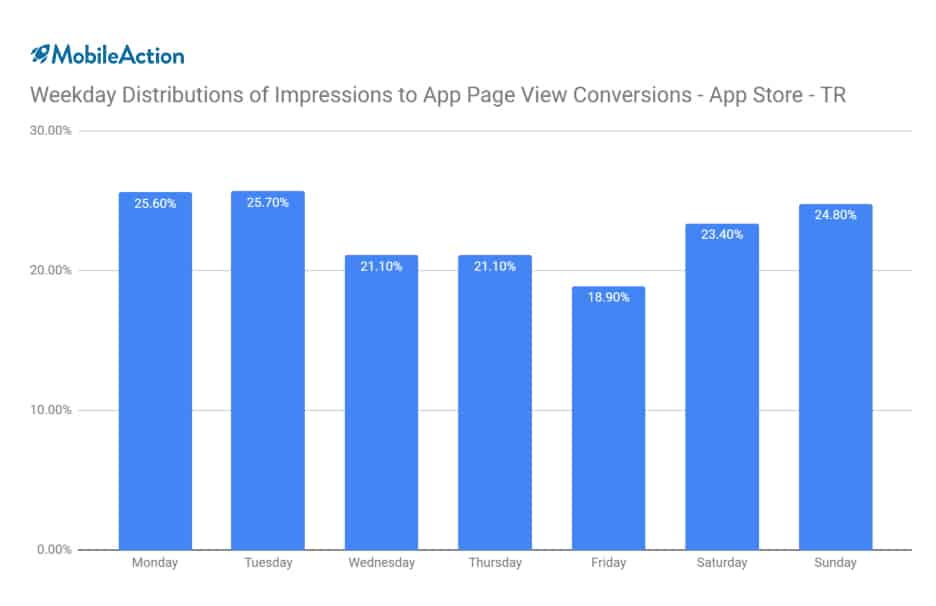
Every 1000 search impression in the App Store leads to 119 product page views and 26 installs on average.
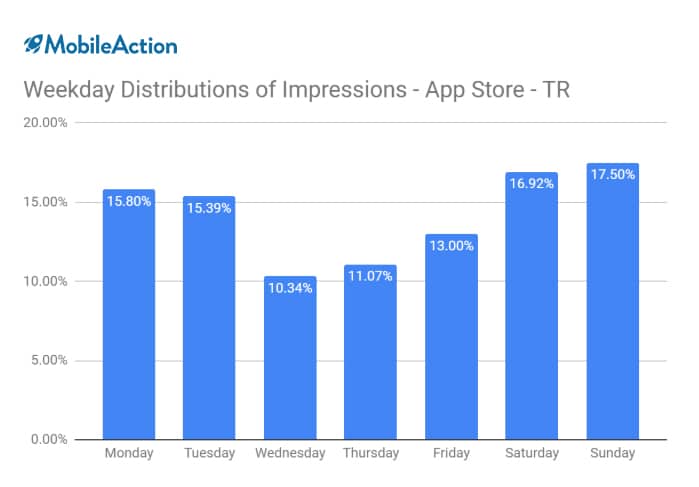
On average, Wednesdays and Thursdays have 35% less impressions through the week.
Every 100 app page view turns into 23 app downloads on average on weekdays, however this number drops to 19 downloads on weekends.
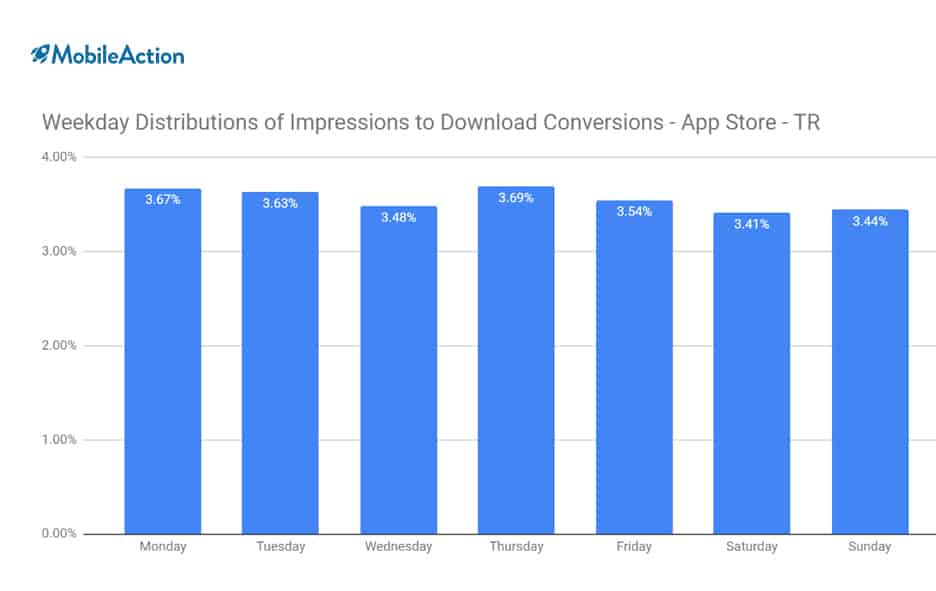
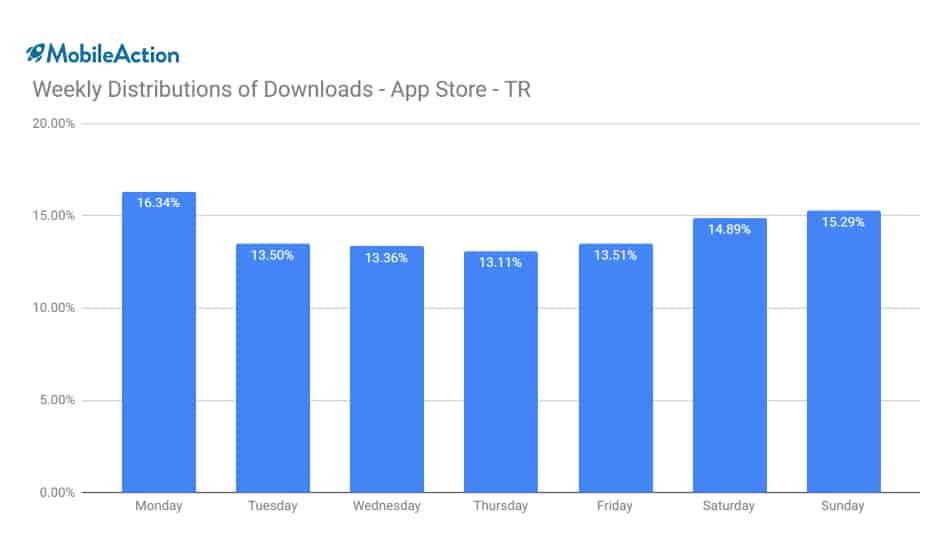
While downloads patterns seem to be evenly spread across the days of a week, weekends tend to get %20 more downloads on average.
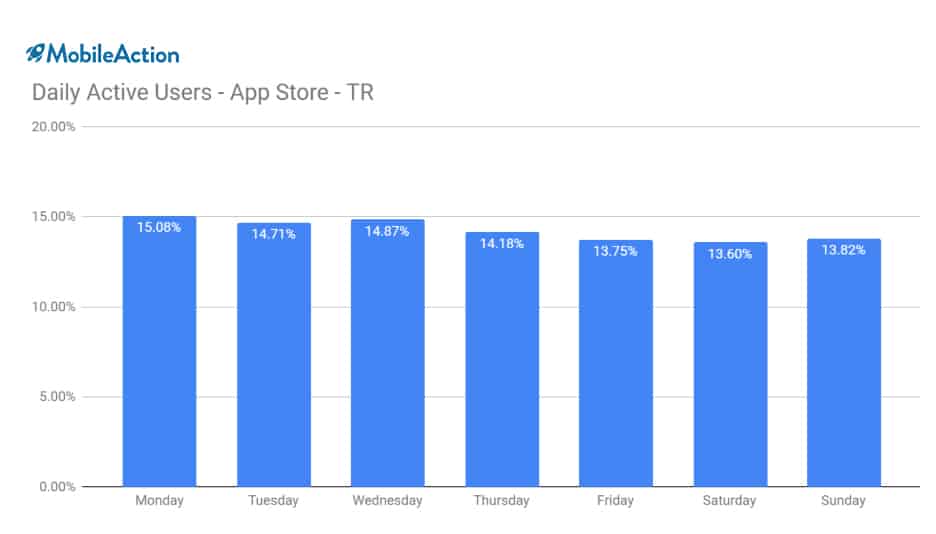
On average, an app in Japan is used once a week per user.
Categories
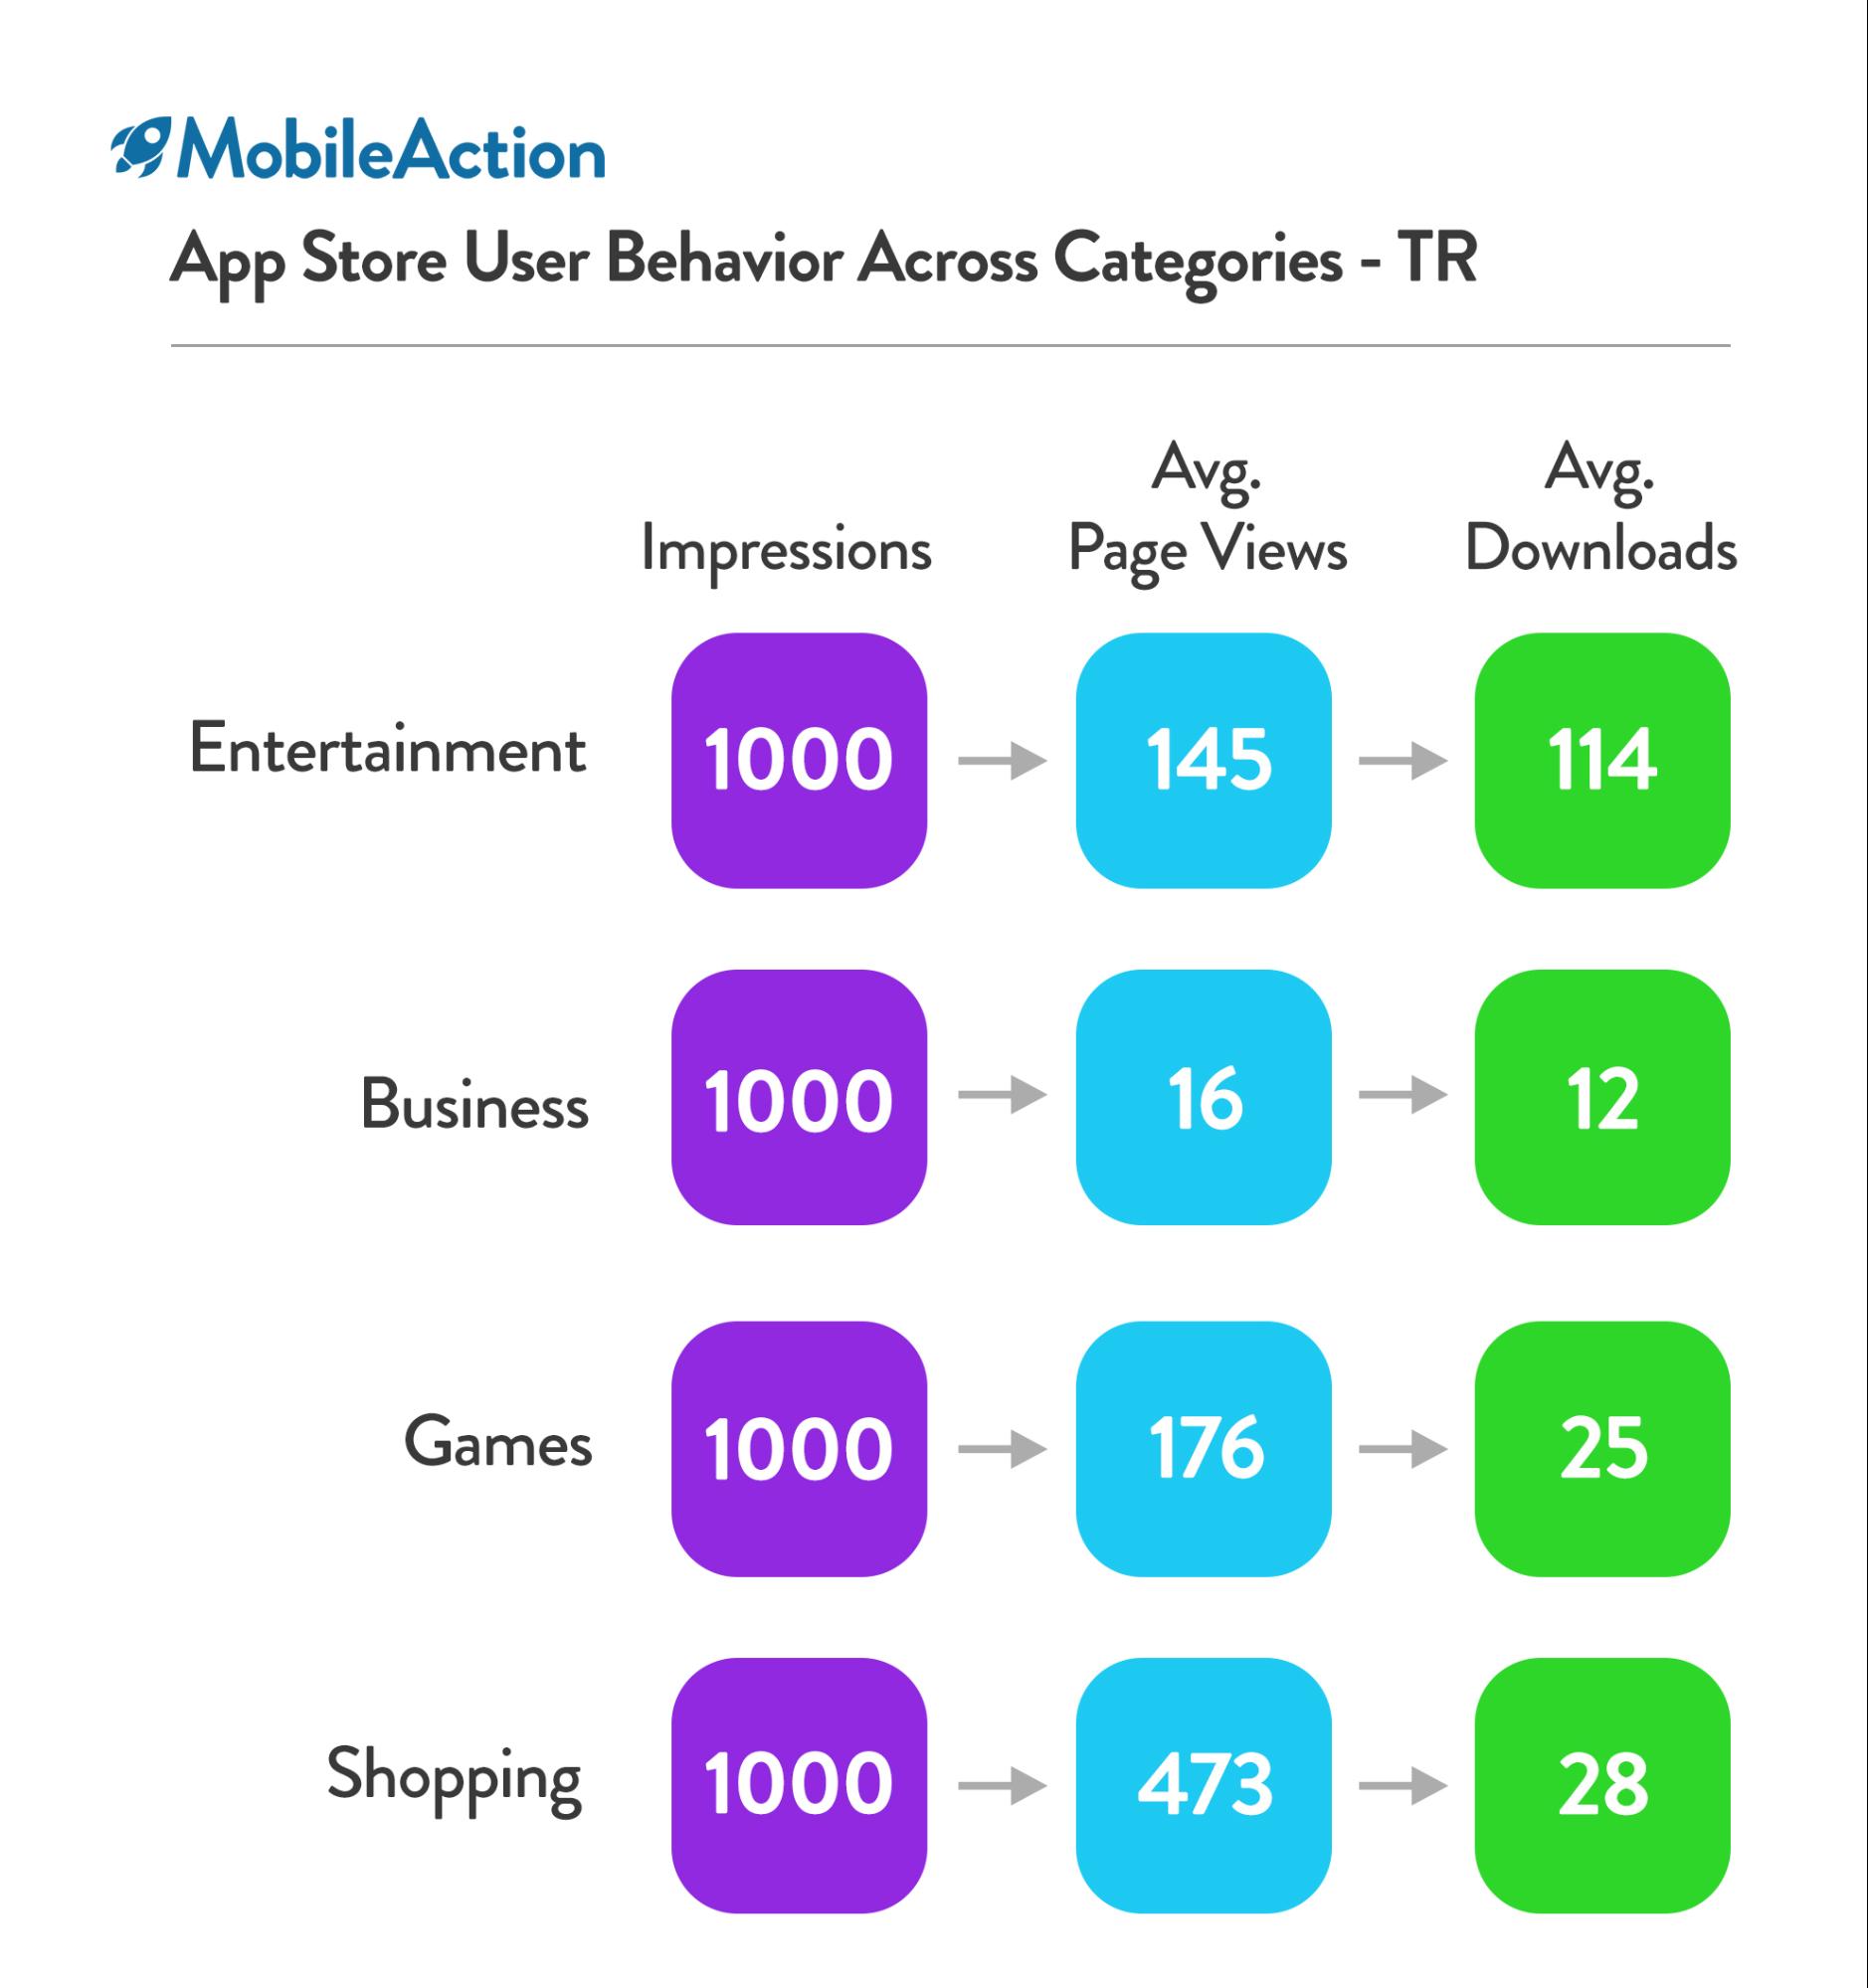
1.The Shopping category is the category with the highest impression to install rate with a whopping 19.5%.”
2. For Business category, every 100 search impression brings 23 page views and 16 installs. When we compare this numbers with the numbers of gaming category, where every 100 search impression brings 14 page views and 1 install, we can assume that most people who search for Business apps, make their choices even before searching.
3. In the Games categories, on average, every 1000 impression only brings 13 installs. On the other hand, every 1000 product page visit only brings 97 installs. The lower conversion rate means that especially for the gaming categories the app store assets such as screenshots, icons, videos and reviews are extremely important.
4. For Japan, conversion rates for education category is extremely low. Every 1000 impression brings 37 app page visits and 6 installs.
All of these insights and even more can be found on the Mobile Action dashboard. Utilizing these weekly download patterns or understanding how the users engage with the App Store in each category will definitely help app marketers and advertisers make the right calls when executing strategy.
Your mobile app growth partner with intelligence, automation and expertise.