Whoever said that money can’t buy happiness simply didn’t know where to go shopping. Or when to go shopping. The answer to the second question is November 26 for this year since Black Friday 2021 will take place on this date.
In this post, we are going to present a comprehensive analysis of the mobile user acquisition strategies of shopping apps. But first, let’s talk a little about the origin of Black Friday, shall we?
Black Friday is the Friday following Thanksgiving Day, and it represents the Christmas shopping season. However, the term of Black Friday actually comes from a financial crisis back in 1869 where the golden market collapsed. A pretty good start for a shopping craziness, isn’t it? Because, without discounts, that much shopping probably still could mean a financial crisis to many households.
It is the busiest shopping day of the year where people sleep in front of shops, wait in long lines, and even battle for goods. However, in the app stores, all users have to do is click on the shopping app, choose the goods they want. No dramas, no battles. This is how it is from the perspective of users.
From app marketers’ point of view, the battles are still on and probably in a more severe way. Because you no longer compete with your locals. Your competitors are coming from all around the globe to steal your prospects. You should gird on a solid holiday season marketing strategy and captivating in-app events to face them successfully.
Don’t worry, we will get you ready for the fight. Let’s start by going over how the top shopping apps are getting ready for Black Friday 2021.
Data Collection
In order to demonstrate the app tendencies in both app stores, we are going to utilize 10 popular shopping apps.
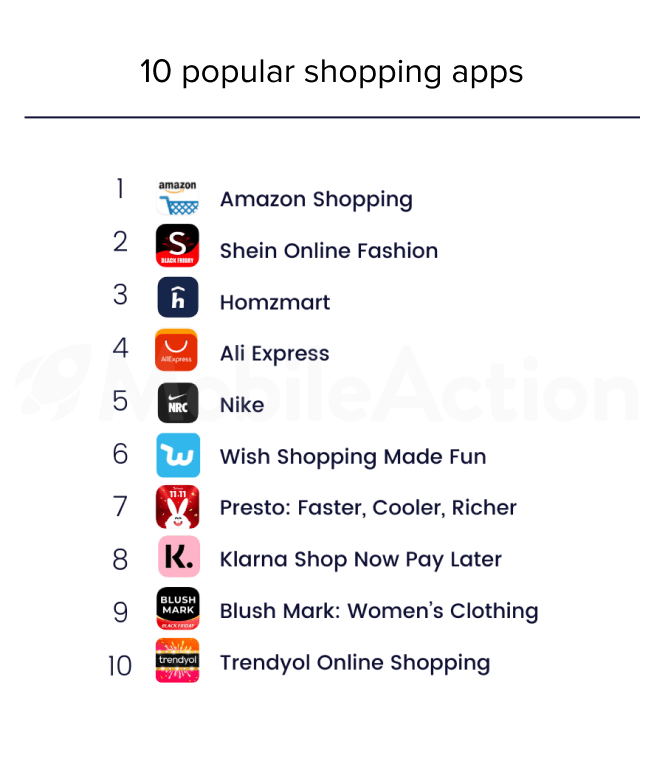
Most of these apps are organically ranking among the top 10 shopping apps in the US. Moreover, they are advertising like madmen, making them perfect for our research. Because they provide a larger sample in terms of mobile ad creatives, ad networks, and ad publishers, allowing us to make truer inferences about the app marketing tendencies. The bigger the sample, the more accurate the reflection. That is why we chose these 10 highly popular shopping apps for this analysis.
Ad Network Counts: Apple v Google Play

The average Ad Network count is 6.9 for the App Store and 8.4 for the Google Play Store. This data may tell us that in Google Play Store, apps prefer working with more Ad Networks. While this is true for some of these apps, we can see that most of them actually stuck to their Ad Network counts in both stores.
The only extreme changes made by Amazon, AliExpress, and Wish. They preferred doubling their Ad Network counts when it came to the Google Play store. However, the performance of these ad networks is what we should really be focusing on.
For instance, let’s take a look at Nike’s mobile ad network distribution.
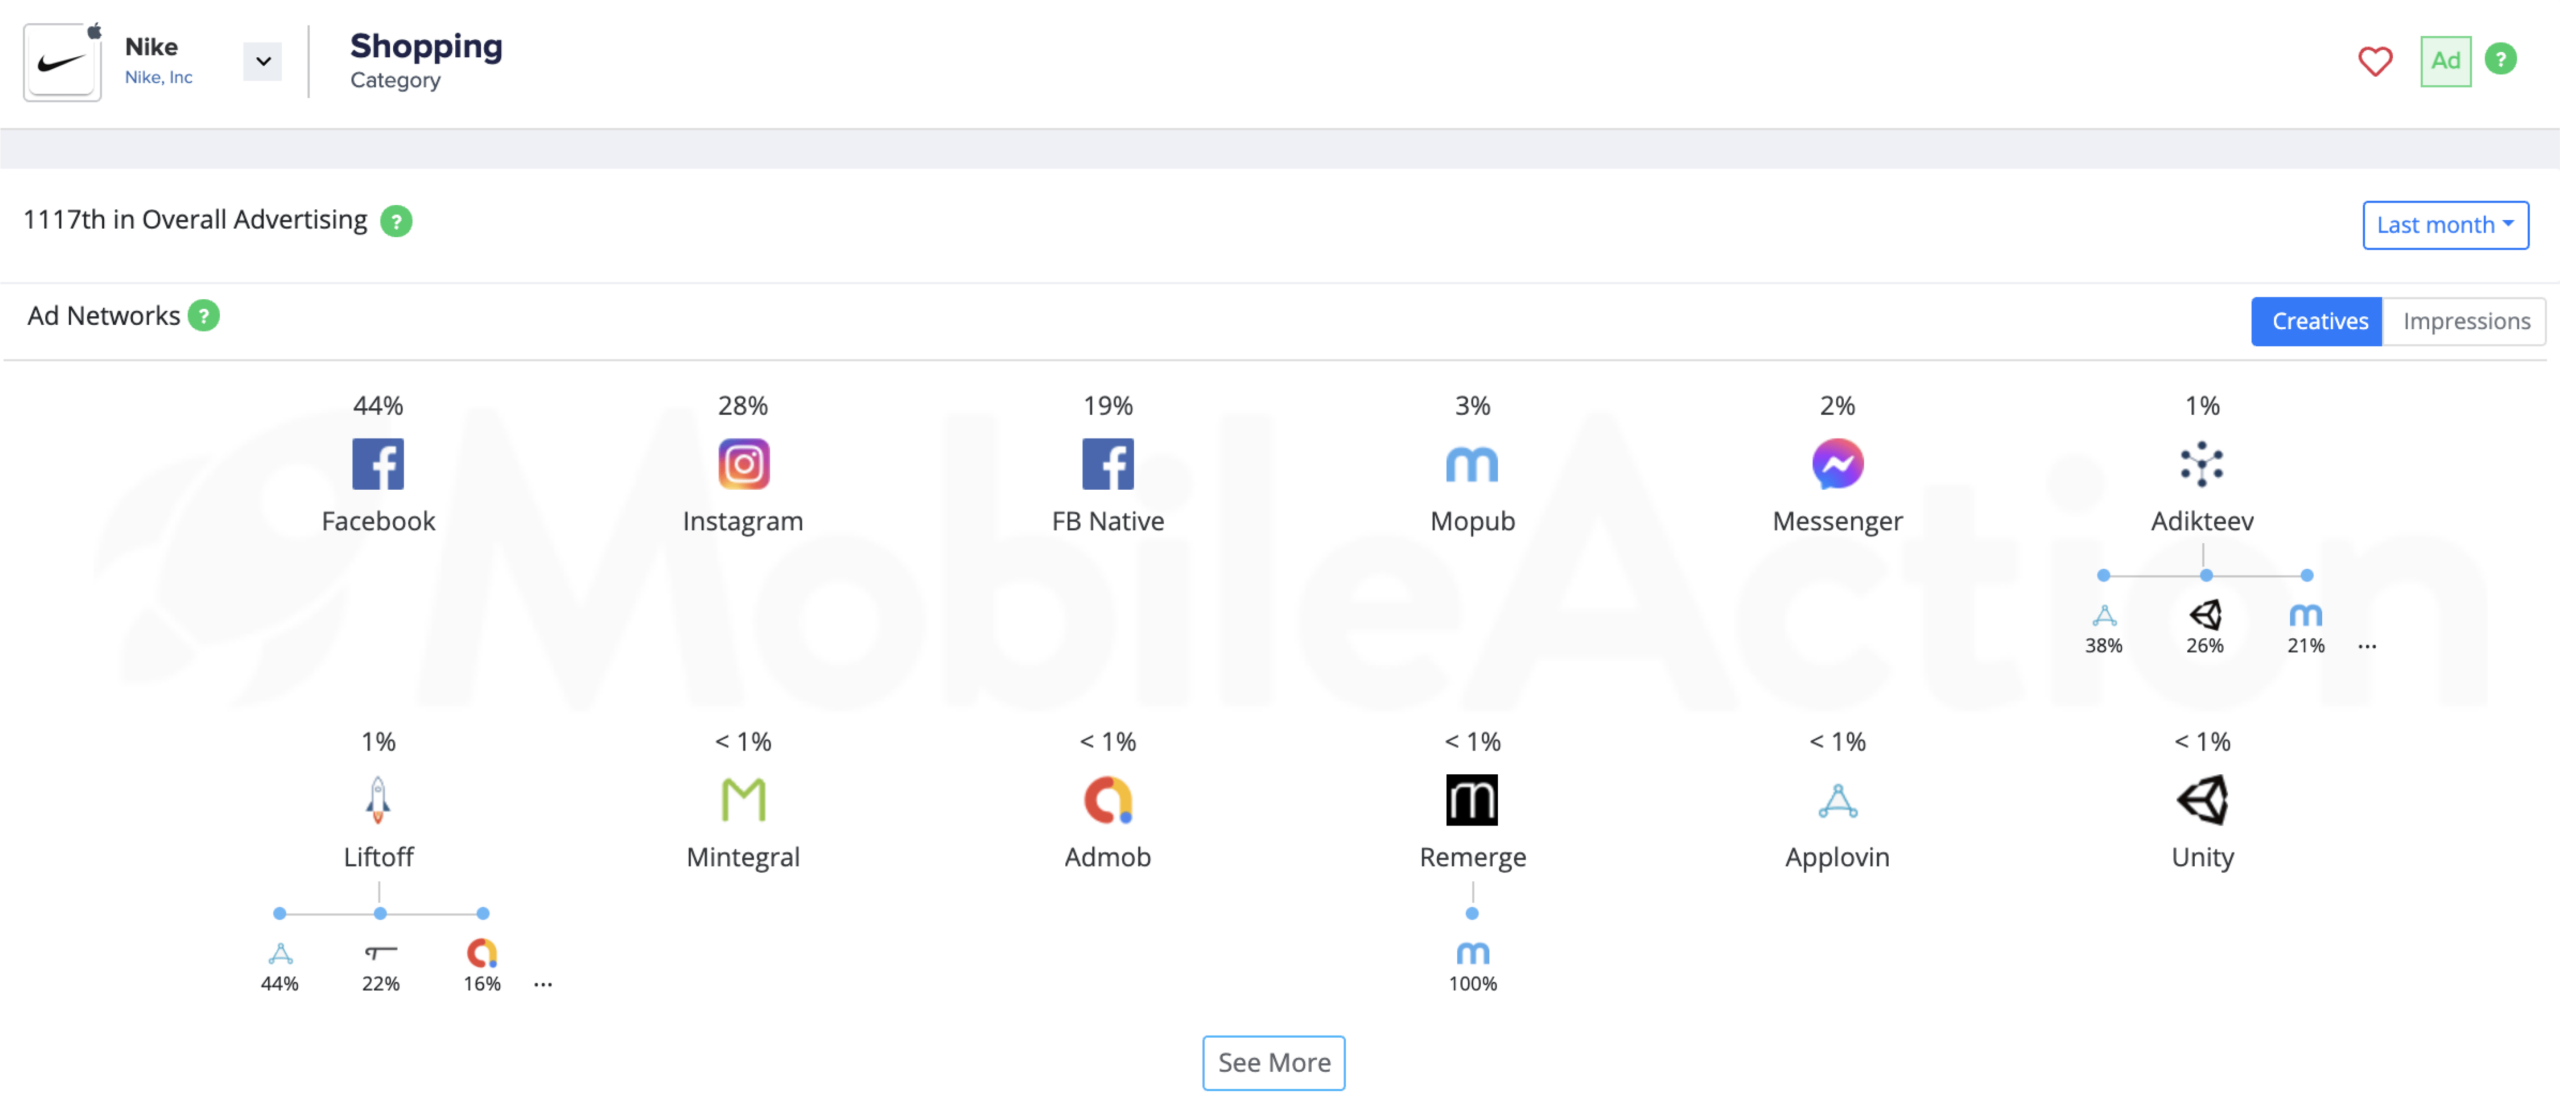
This dashboard shows how Nike distributed their mobile ad creatives in the last month. They sent 44% of their ad creatives to Facebook and 45% in total to Instagram and FB Native.
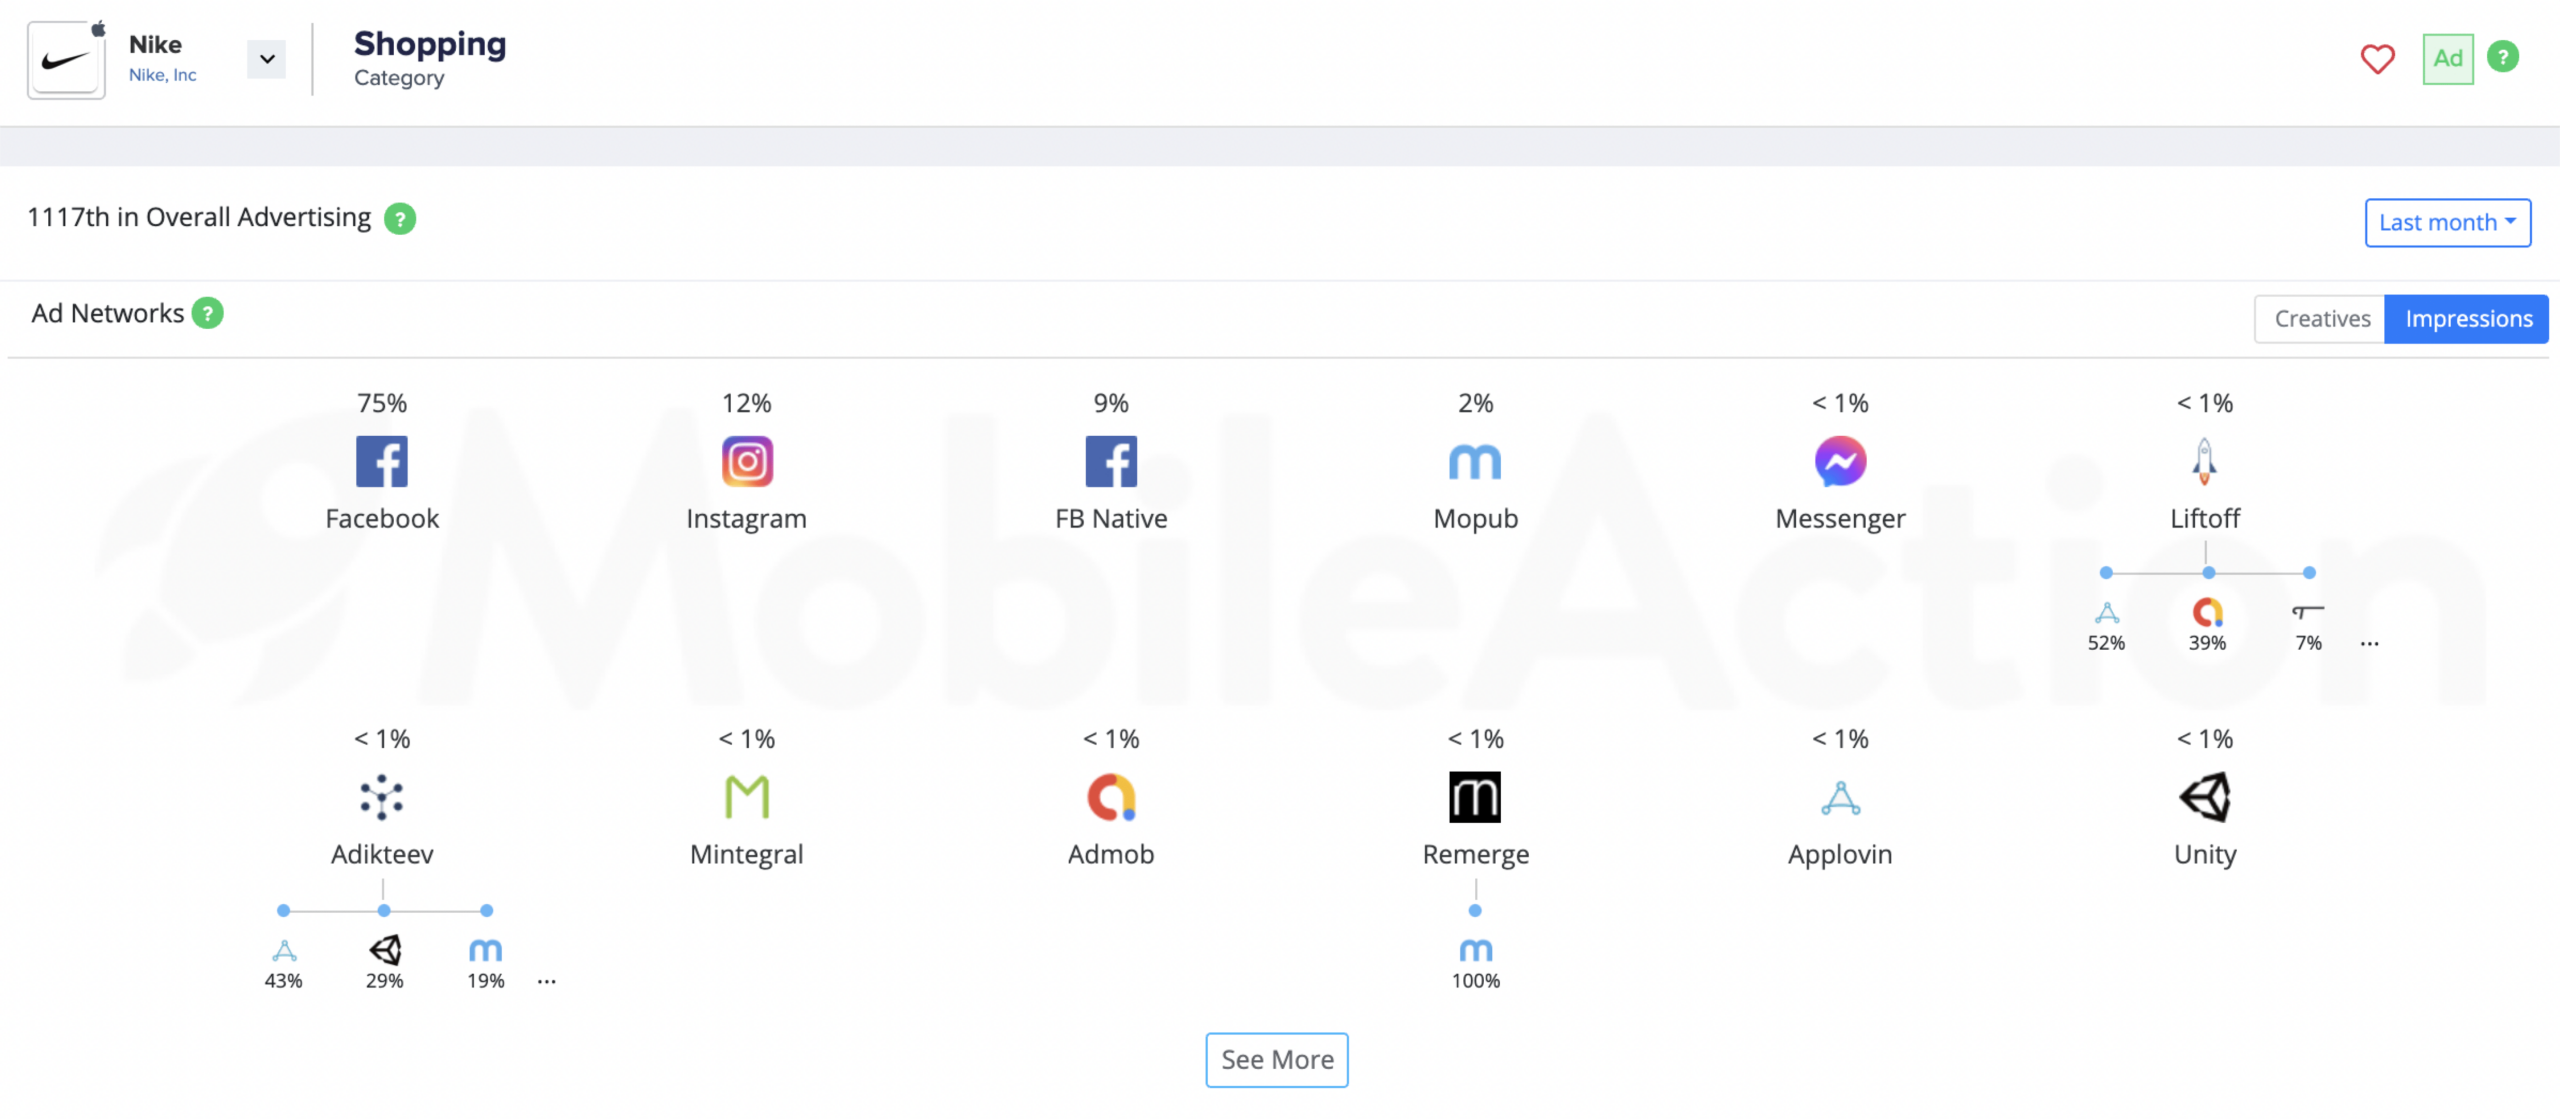
Although Instagram and Fb Native have more ad creatives in total than Facebook, things change when we look at the impression distribution. As you can see above, Facebook alone is responsible for 75% of their total impressions.
Therefore, increasing the number of ad networks without looking into their performances might not benefit your campaign as much as you hoped. Especially if you don’t know how your ad creatives have been distributed. As you can see above Liftoff distributed Nike’s creatives to other ad networks such as Applovin, Admob, and Tapjoy (yes, this is the cool new feature of our Mobile Ad Intelligence tool). In terms of impressions, Facebook still seems to be the most effective platform for shopping apps.
Total Ad Creative Count is Higher in Google Play

Shein, being the top advertiser of the shopping category, ran more than 45k ad creatives in total for October 2021. AliExpress follows with 10.500 ad creatives but as you can see there is a huge gap between the number 1 and 2. However, in general, running 4k to 5k ad creatives seems to be the average for the shopping category.
The graphic tells us about a clear distinction between the app store preferences of these apps. Only Nike is approaching both app stores in the same manner. The others have extreme differences between their ad creative counts for these two platforms.
Since the release of iOS 14.5, the gap between the ad creative counts in these two stores has increased in general, which is consistent with our analysis for shopping apps. It is likely that advertisers have been shifting their advertising budget in the App Store from creative advertising to Apple Search Ads, which we will look into shortly.
Higher Keeping Ratio in Google Play

Shein again leads the crowd, with the highest active ad creative count in both app stores. 13k active ad creatives in total are extremely ahead of the curve. Moreover, the active/total ratio is not that high for the shopping category. As a result, the average active creative count seems to be around 1k to 2k in total.
How shopping apps approach the app stores lies under the A/B Testing ratio. The active/total ad creative ratio is around 25% for the App store and 37% for Google Play. It seems shopping apps test more in Google Play as opposed to the App Store.
Image and Html Ad Format Dominates
The format distribution of ad creatives depends highly on the category of your app. While Video was the dominant ad format for Hyper-Casual games, only 10% of Shopping Apps’ total ad creatives were in video format.
Html and Image formats appear as the main squeeze of this category since they are utilized in 90% of total ad creatives.

As you can see, in both app stores the Html and the Image formats are the main choices for shopping apps. You can utilize video creatives to show features of your app that need motion. However, engaging users with 30 seconds long videos to tell them that you have discounts or the goods that users want is extremely difficult. Most of them probably will leave after 5 seconds. Instead of this, you can show an image of your goods that are in the sale. This is easier, cheaper, more captivating, and therefore will be more effective.
Now let’s take a closer look at the paid user acquisition strategies of Shein and Blush Mark.
Shein – Dominating the Ad Space in the Shopping Category
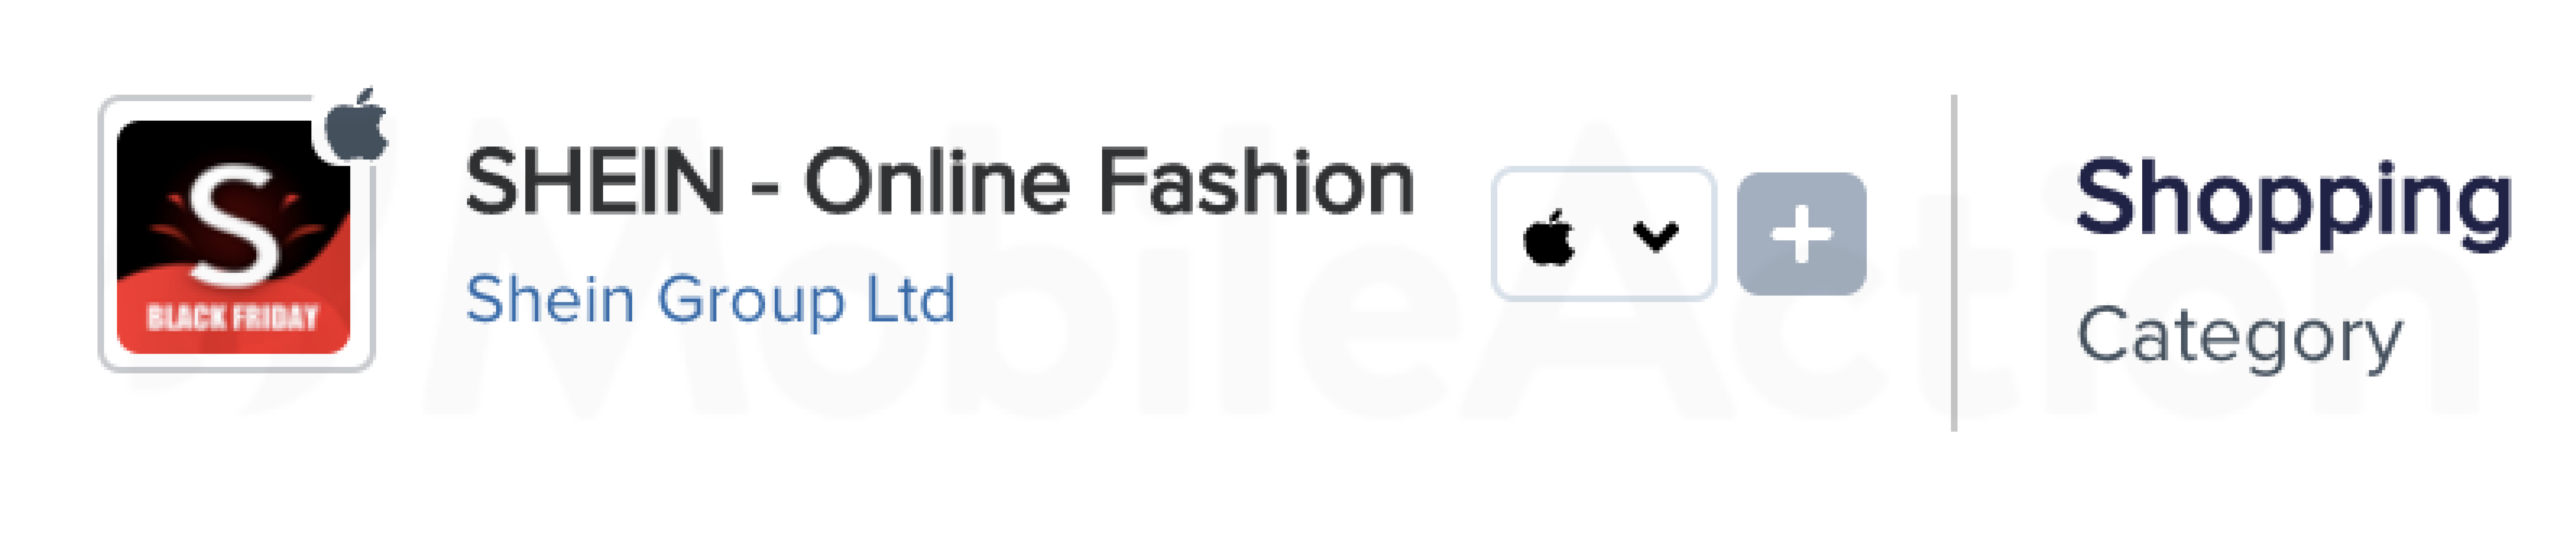
Shein began its preparation for Black Friday 2021 with a little change on its app icon. As we go further, you will see that this simple step is actually embraced by many. Because it sends a clear message to the users who are looking for Black Friday 2021. Moreover, it helps increase retention scores due to the fact that it will also attract existing users. That is why these changes in app icons are in fact truly beneficial for your user acquisition goals.
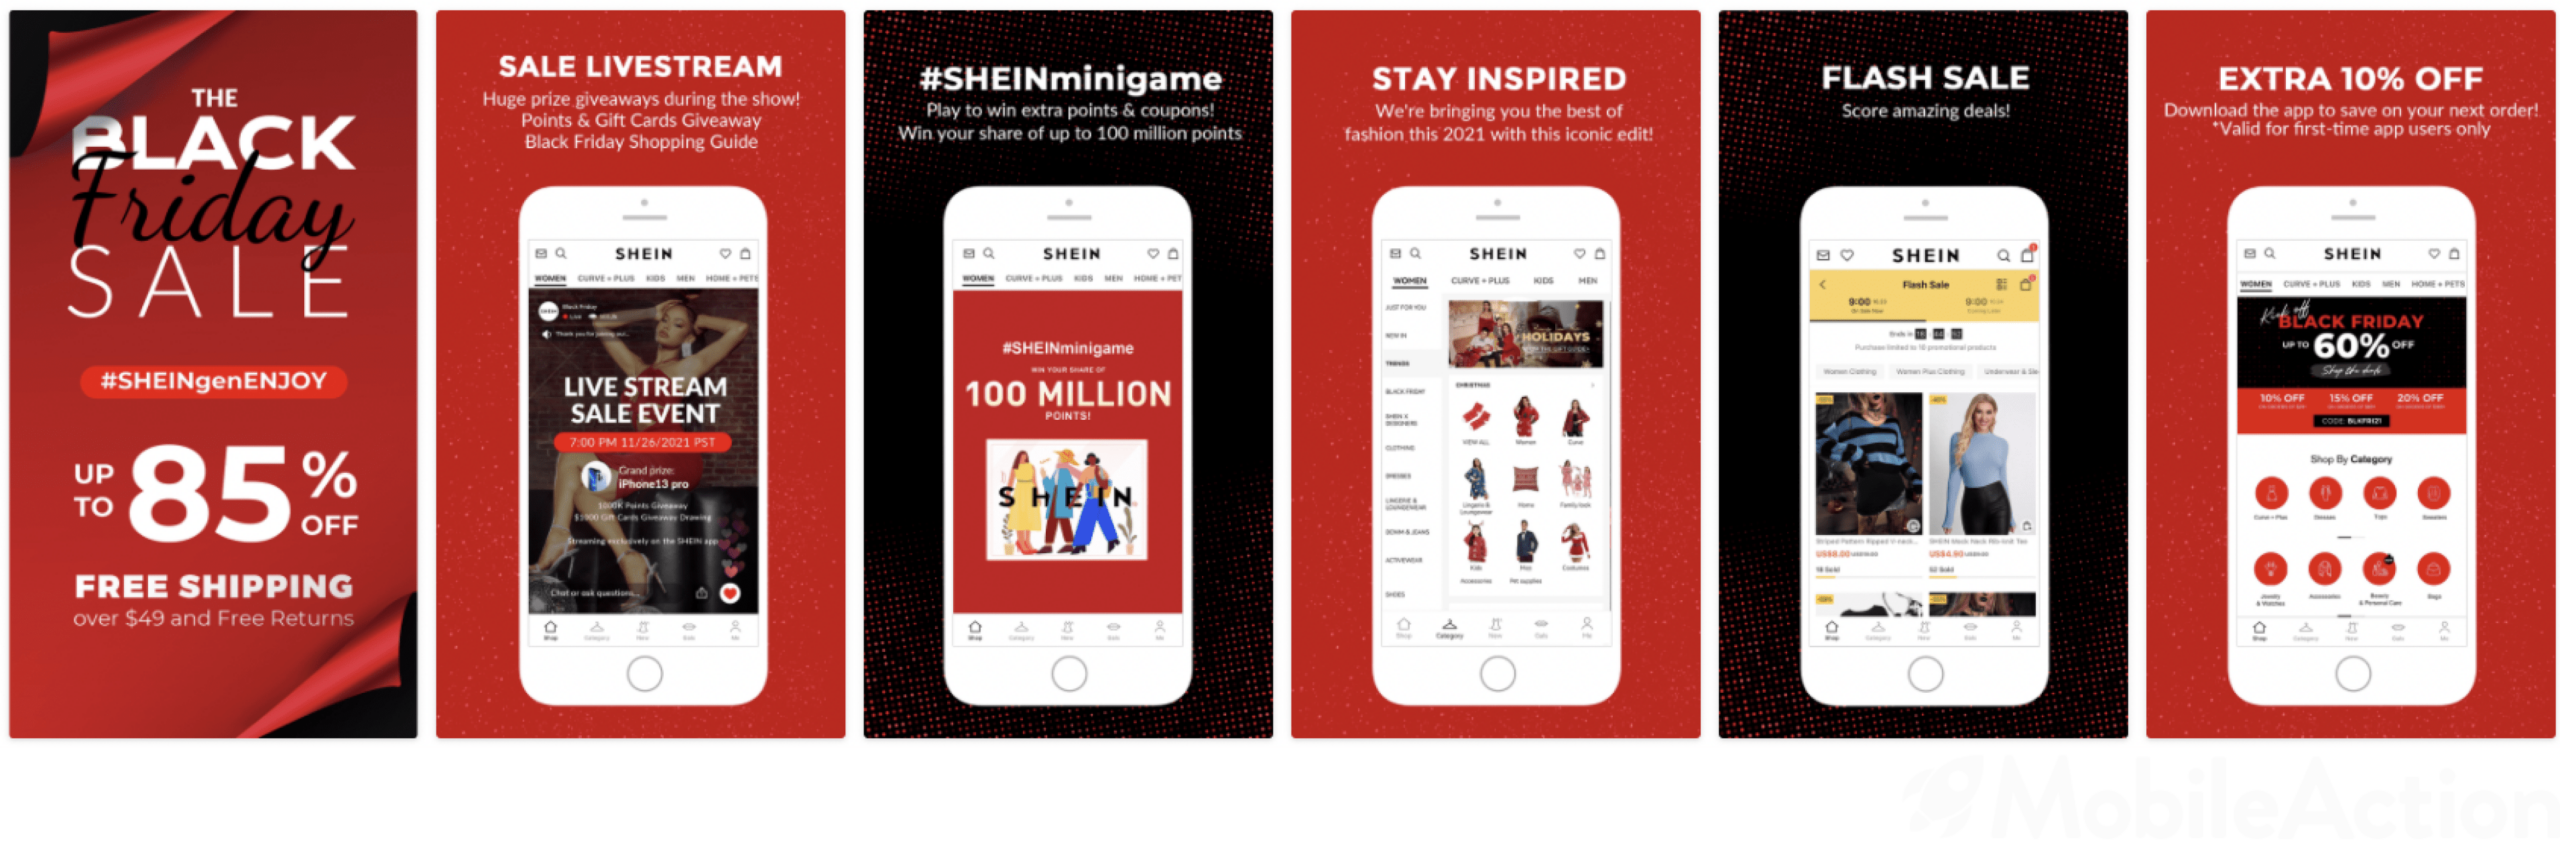
The next step of adjusting your creative assets to the season is your video previews and screenshots. As you can see here, Shein changed its screenshot set to fit better to the season. They brought to the front their high discounts and events related to Black Friday 2021. They showcase their giveaways, minigames, and flash sales to complete the conversion.
You can take a closer look at their changes with our App Update Timeline feature.
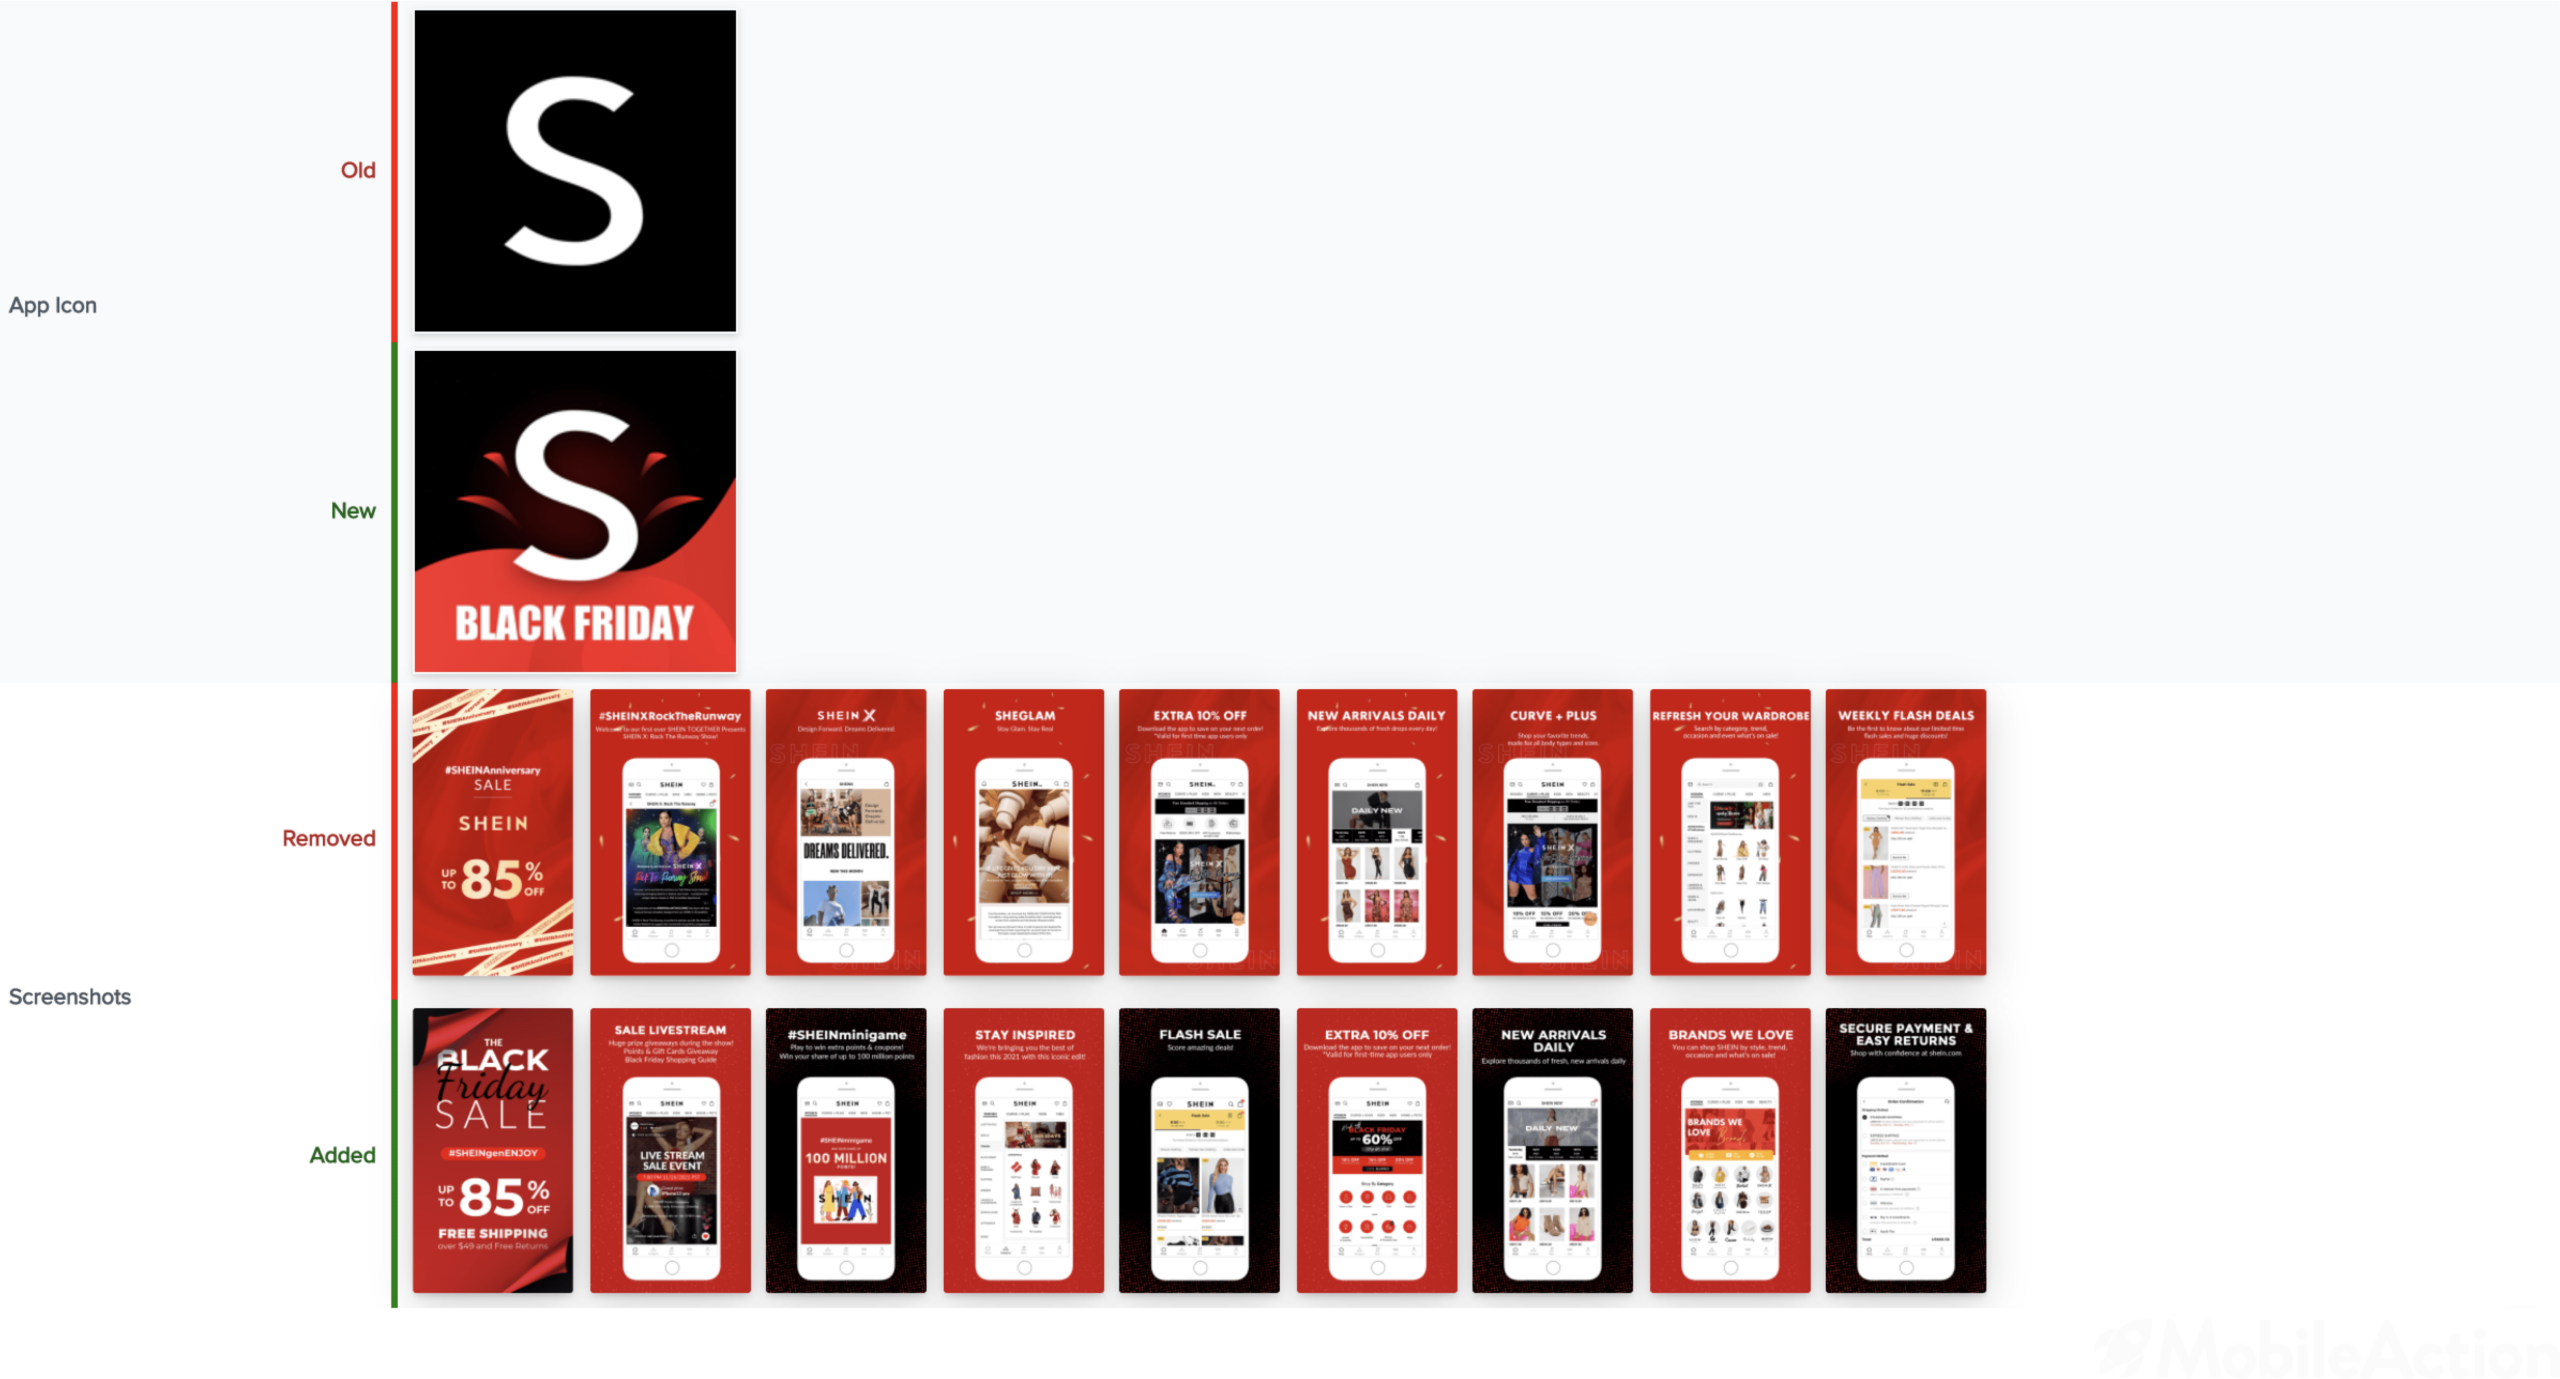
As seen above, their previous app icons and screenshots are presented with their current ones. Moreover, you can track every aspect of their updates from promotional texts, to category changes. In this way, you can analyze your competitors better and improve your user acquisition strategies accordingly.
Now, let’s study their top creatives a little bit.
Ad Creative Analysis of Shein
80% of their ad creatives are in image format so let’s start with one of their image ad creative. Below you can see that they utilize a model wearing one of their products. As mentioned above, it is an effective way to attract shopping lovers.
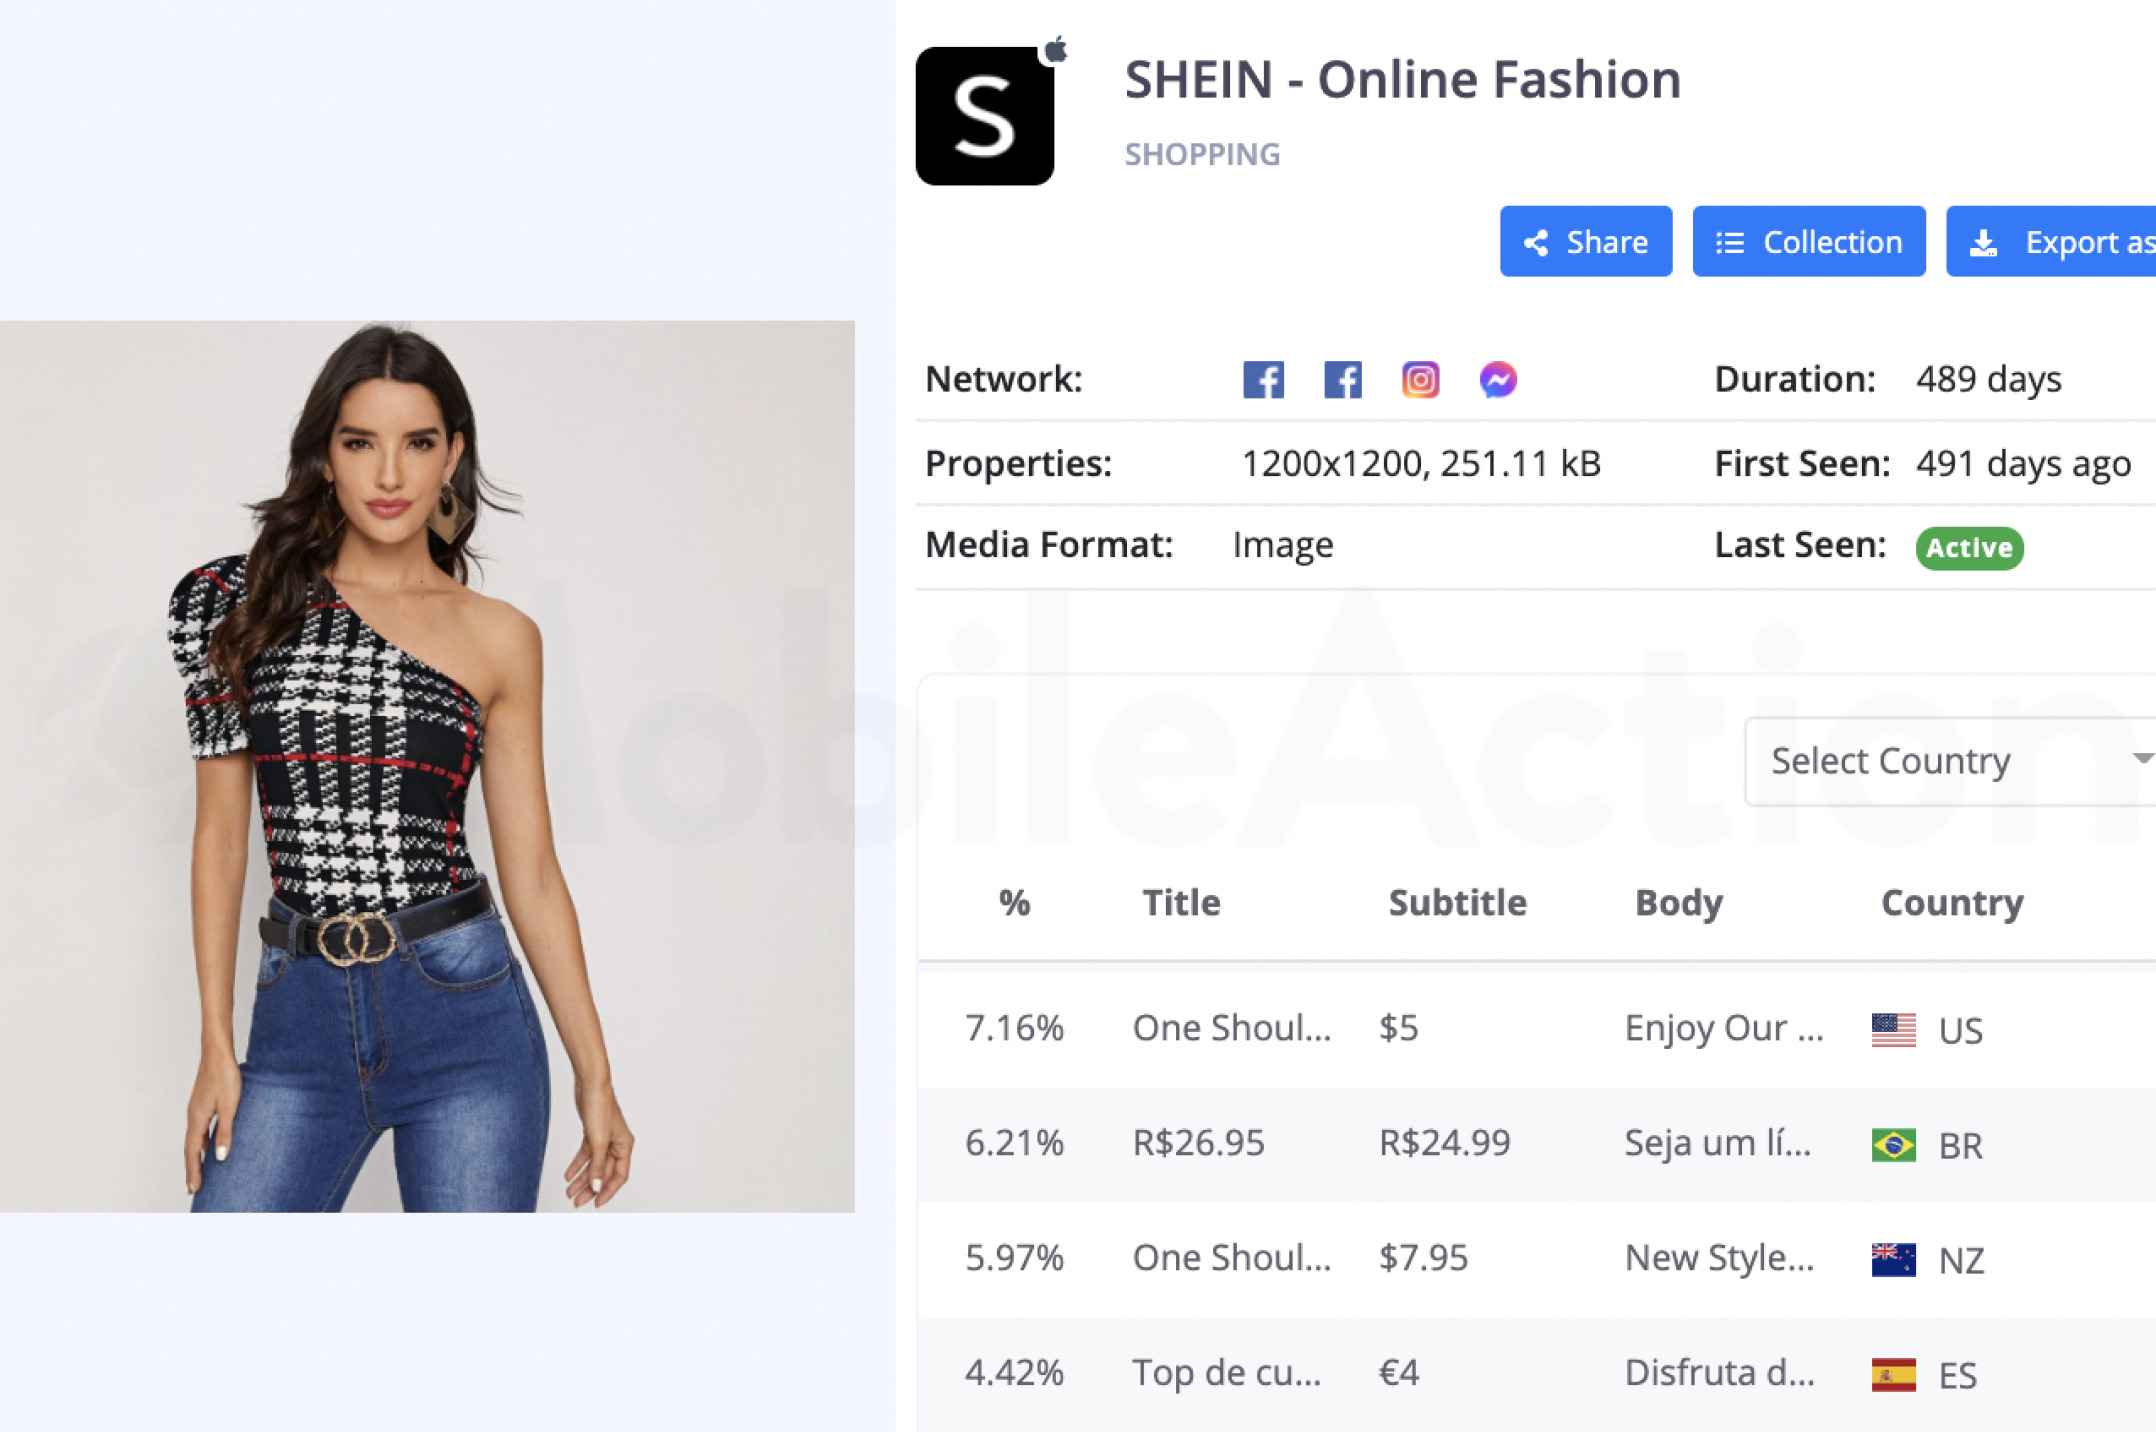
However, we can also see that they are localizing the CTO, title, subtitle, and body of the ad creative. Although a visual can be seen as universal, it is always better to add local elements to your ad creatives. In this way, you can improve your communication with your prospects.
Black Friday is good but how about a slow Sunday. Here Shein showcases their products for a relaxing bath and ties them to a theme.
Remember the theme of Black Friday? Shein vitalizes this idea in their video ad creatives to welcome users with the spirit of the season.
These examples tell us that it is better to present your products with an idea rather than cold exhibitions. Don’t just show, tell a story.
Apple Search Ads Strategies of Shein
As you might already know, Apple Search Ads is one of the best ways to promote your app in the App Store. In the Appflyer Retention Index, it was the leading user acquisition platform. It helps app marketers reach out to high-quality users who are inclined to download your app and use it for a longer period of time.
So let’s see how Shein benefits from Apple Search Ads.

They are utilizing 4601 paid keywords in the U.S and run Apple Search Ads in 35 different countries.
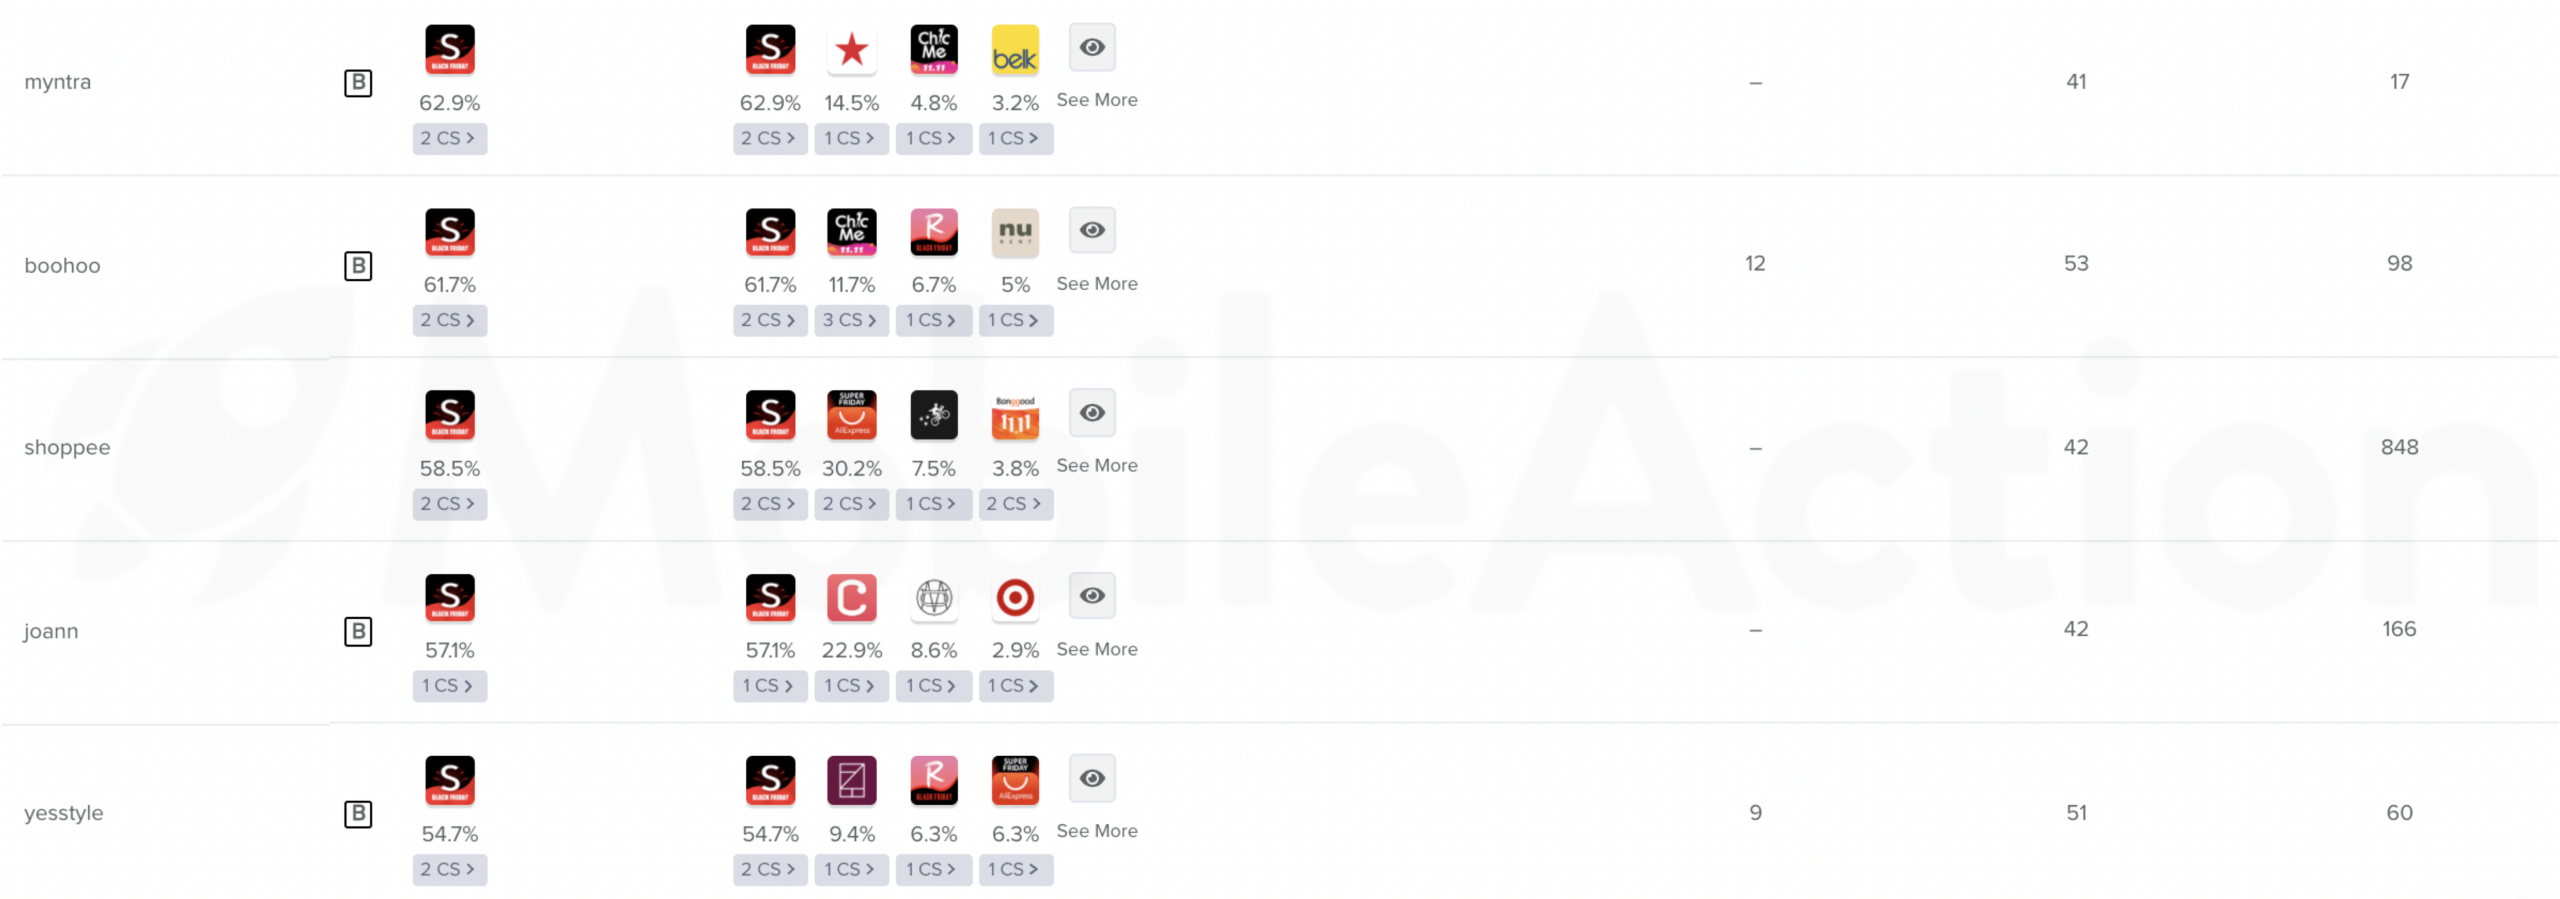
Shein dominates its competitors’ brand keywords. As you can see, in all of these keywords, Shein has at least 50% of the impression share. This approach enables them to reach out to new users who actually searched for their competitors’ apps.
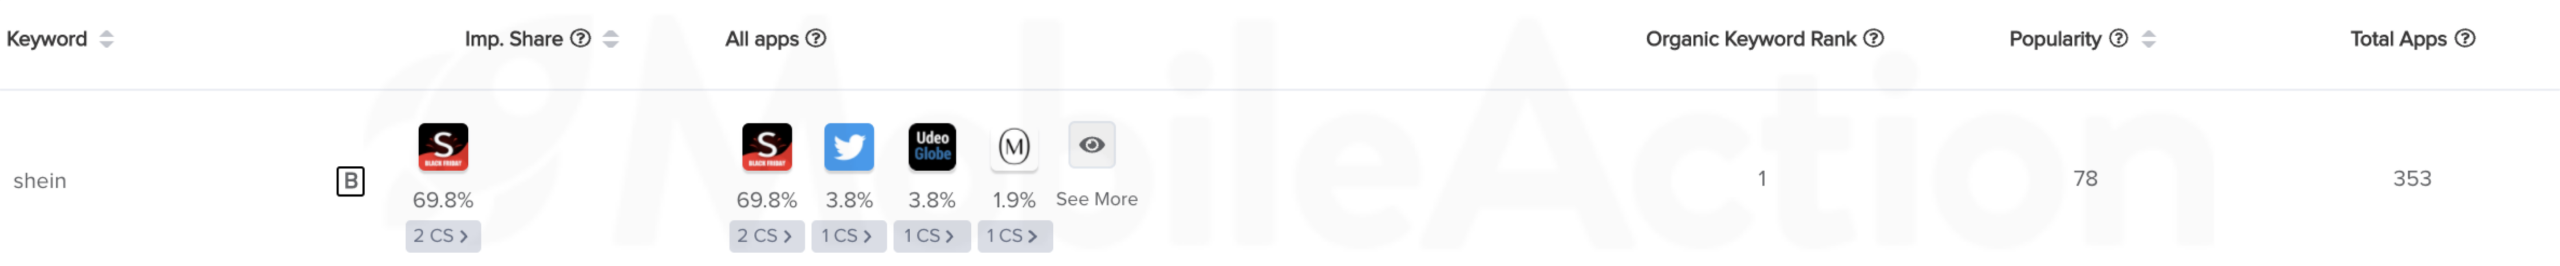
Since Shein chases after their competitors’ brand keywords, why wouldn’t their competitors come after Shein’s brand keyword? For this matter, although Shein organically ranks the first for its own brand keyword, Shein bids and gets 70% of the impression share. Never forget to defend while attacking.
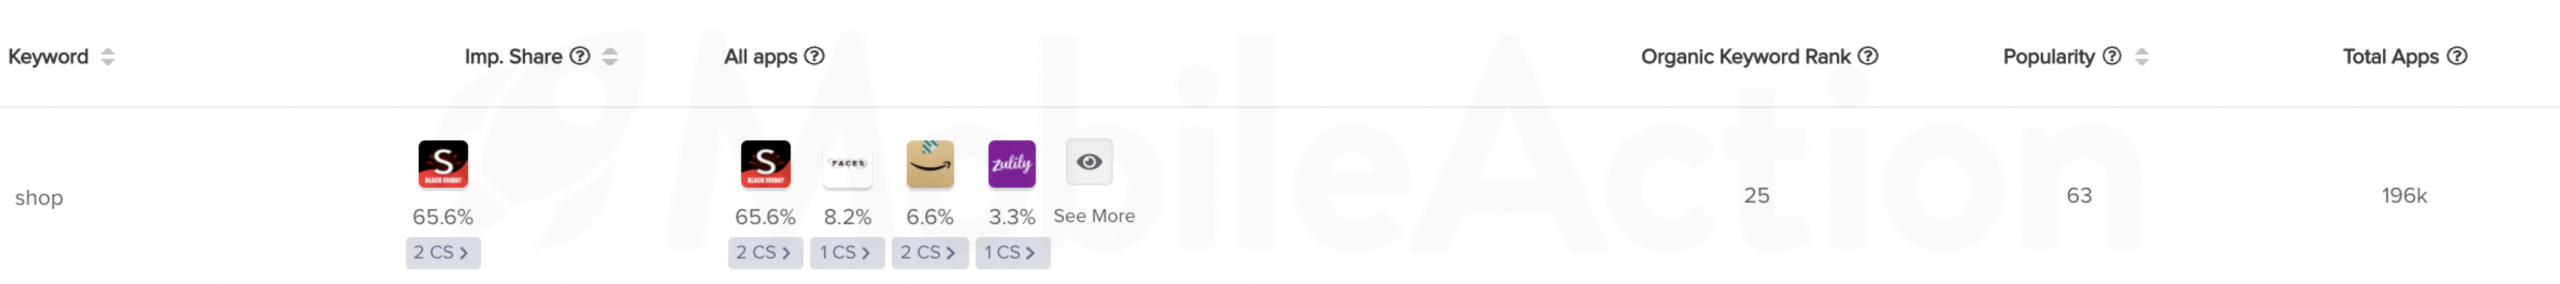
Furthermore, they are also getting the lion’s share in generic keywords. The keyword of “Shop” has a popularity score of 63, which is pretty high. So, getting 65% of impressions for this keyword can actually boost your download volumes dramatically.
Blush Mark – Women’s Clothing
As you can see, Blush Mark, one of the most downloaded shopping apps is also doing what any successful app marketers should be doing. They tune up their creative assets for the season.
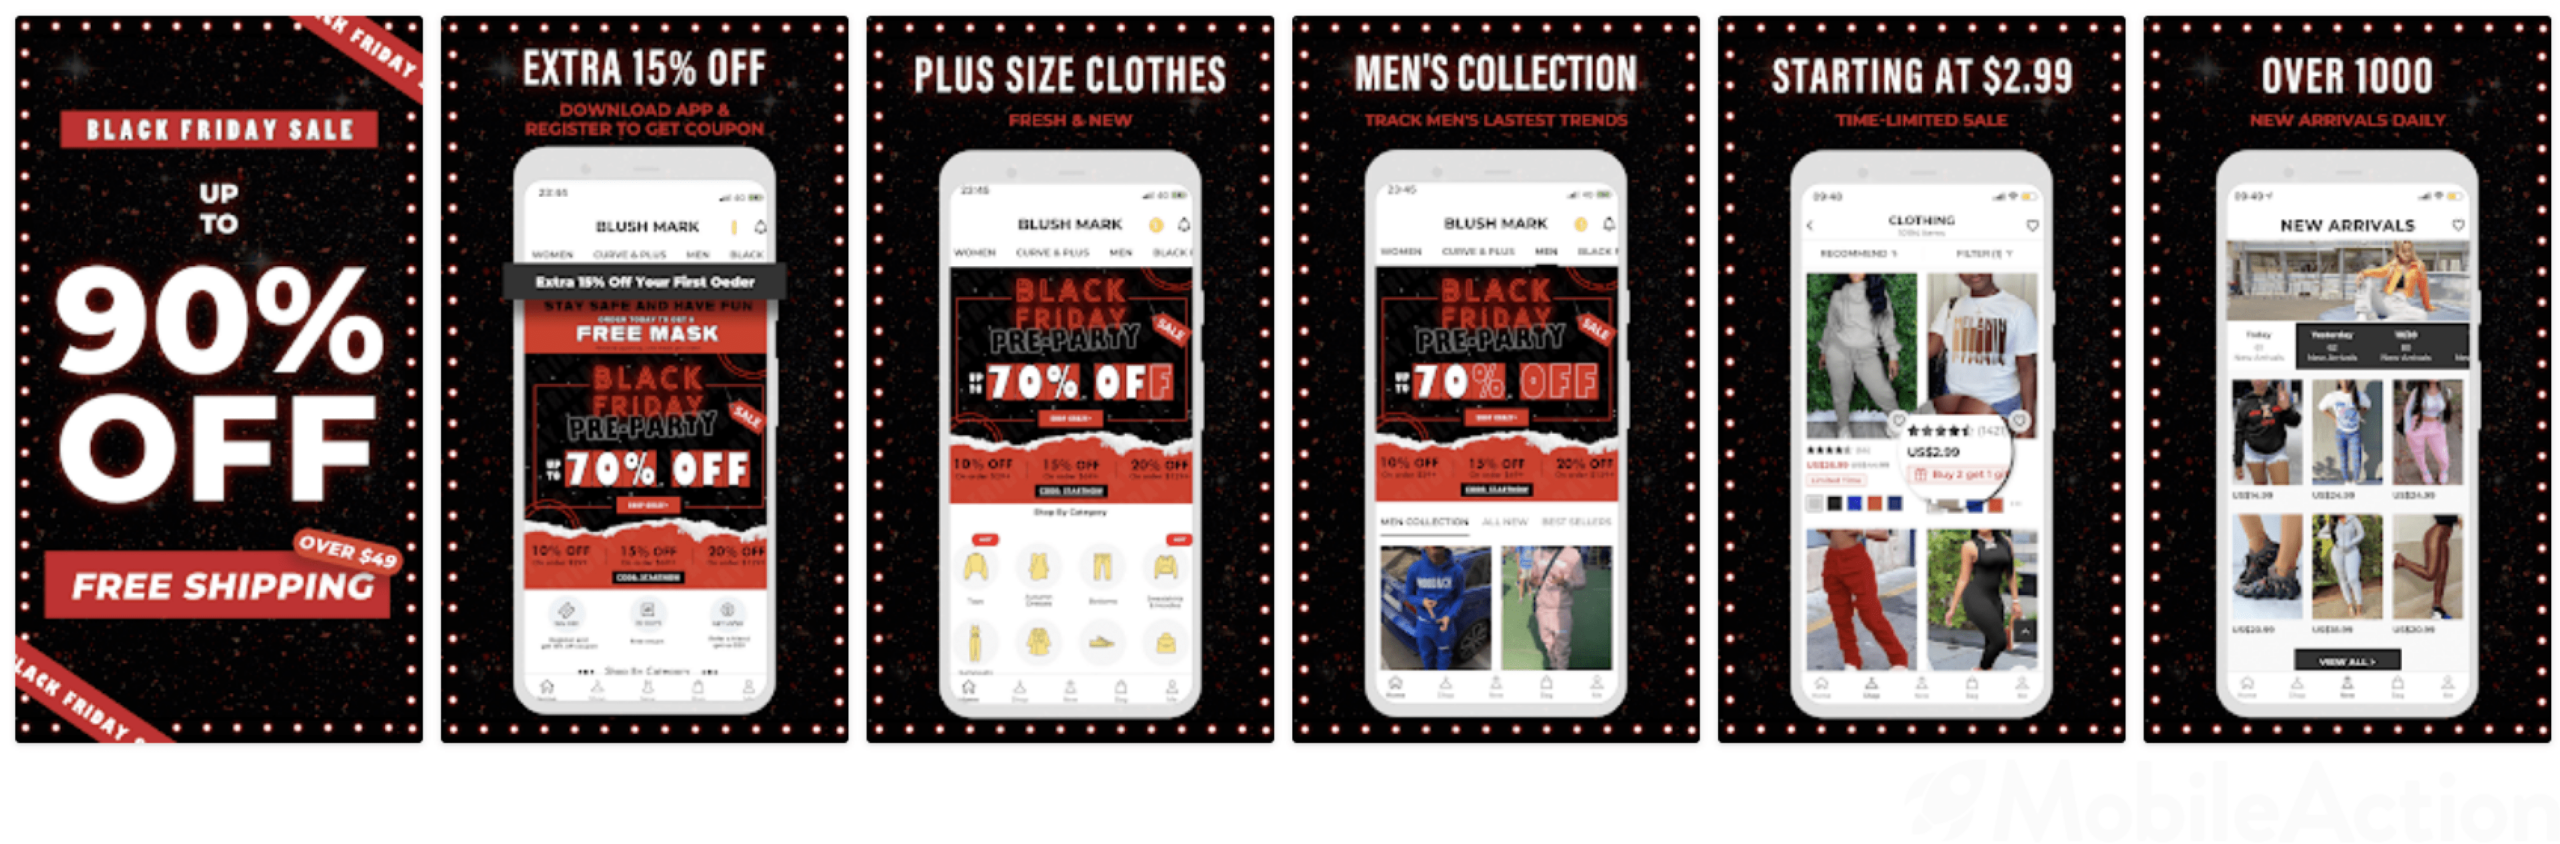
These changes may seem insignificant at first. If the app and the features of your app remain the same, what impact could backgrounds and banners do?
First of all, even the background color can influence your conversion rates. Especially if you adapt it to the theme of the season.
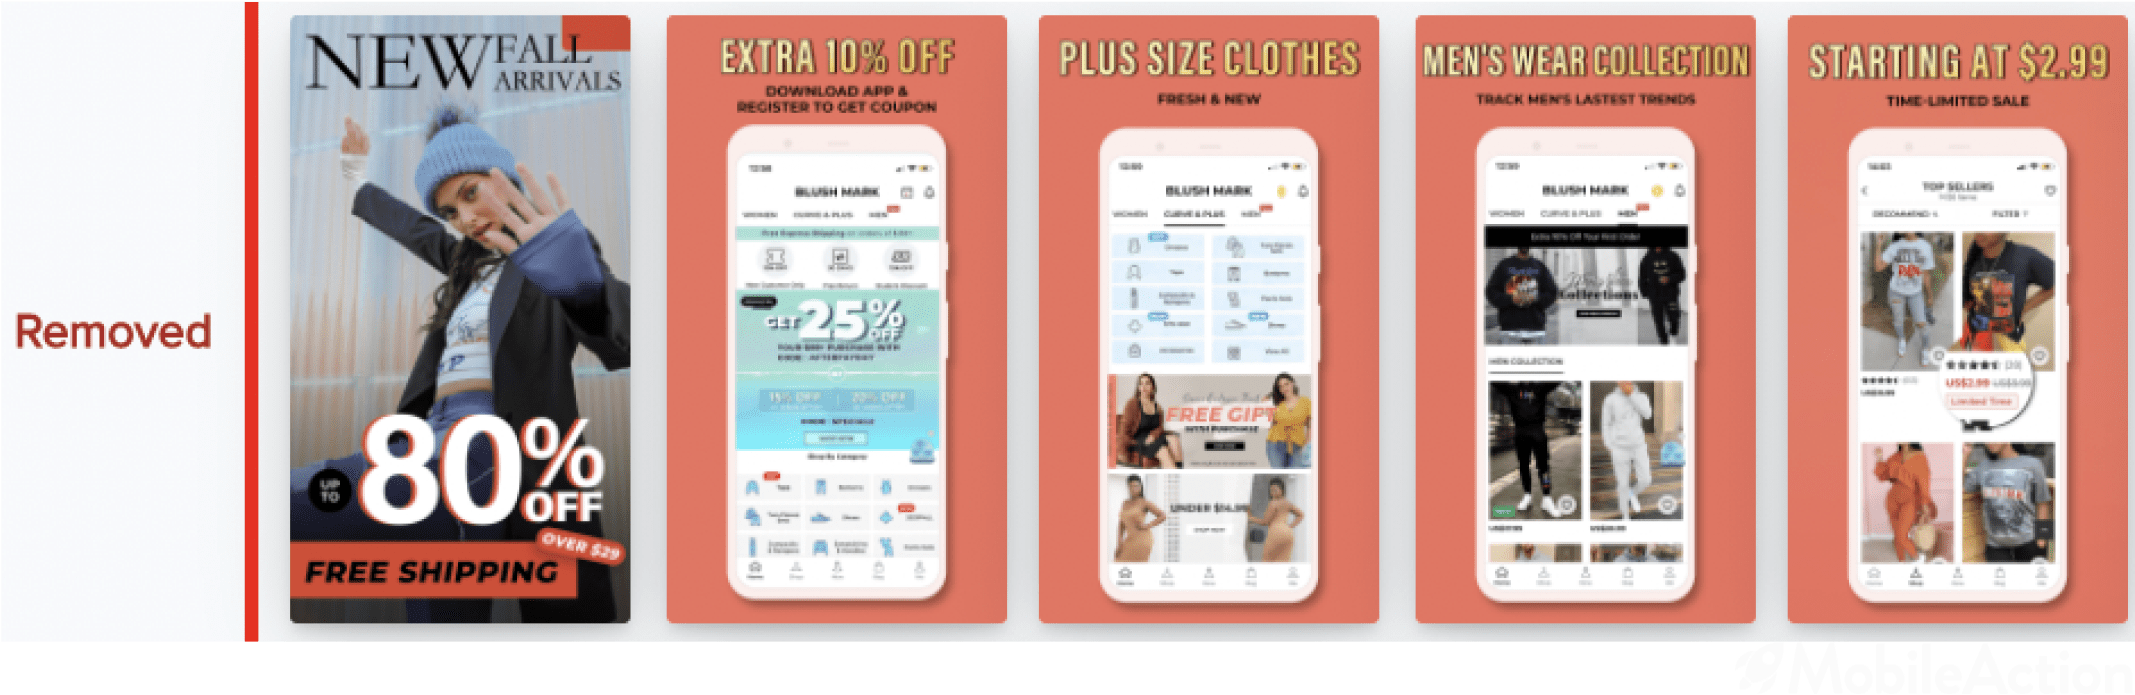
This was the previous screenshot set of Blush Mark. Although it also has a concept, it would not fit into Black Friday 2021. As seen, they changed the background color to black and surrounded the corners with shiny dots that give the sense of a store window. In this way, they catch the attention of users who are already bought into the idea of Black Friday.

As seen above, Blush Mark runs this image ad creative heavily on social media channels. We can also claim that they target mainly American and French users with this ad creative. And, they are localizing the ad creative accordingly.
Who doesn’t want affordable and cute clothes, right? Probably the fashion boutiques that overcharge for their custom-made products, and the customers of these boutiques. However, Blush Mark does not target them so they made it clear by saying that you can find affordable clothes in this app. Furthermore, they create a sense of authenticity by benefiting from a person who is not a celebrity.
Studies show that people tend to follow advice from their fellows, co-workers and etc. Since you cannot pay everyone to promote your brand, working with ‘normal’ people in your ads can be a nice way to connect with your target audience.
Apple Search Ads Strategies of Blush Mark
If you want to benefit from seasonal app marketing but don’t tailor your Apple Search Ads keywords accordingly, success won’t come to you.

Here, we see that Blush Mark actually targeted the related keywords to Black Friday yet they are not getting enough impressions from them. Amazon, Slickdeals, and Flipp get the largest impression shares for these keywords.
In such cases where you are bidding on highly competitive keywords, automation rules can be used to increase your impression shares by adjusting your bids automatically depending on market conditions.
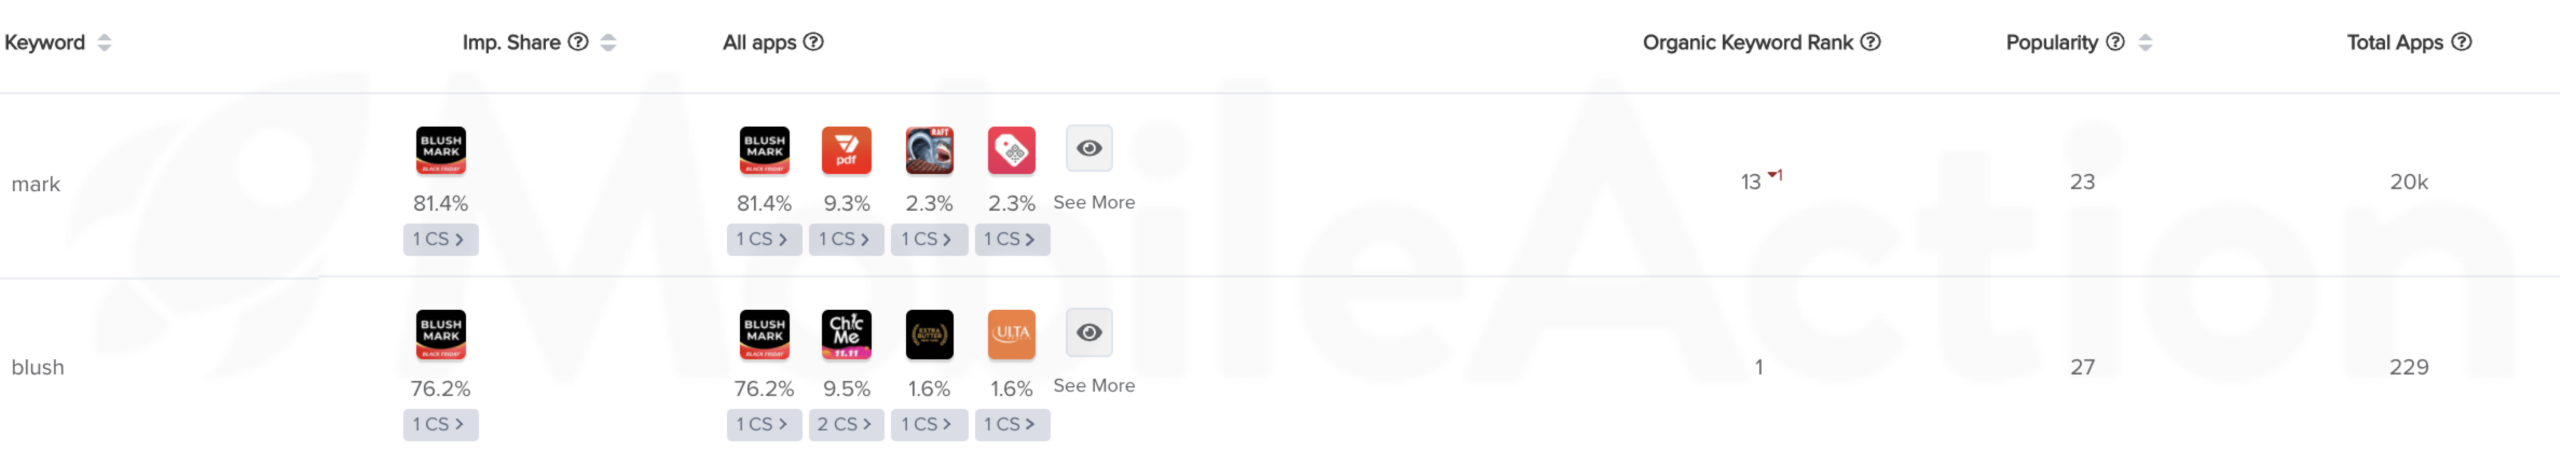
Apart from this, they are protecting their brand keywords in Apple Search Ads. However, when it comes to getting high shares from popular keywords, their impression shares seem to be a little lower.

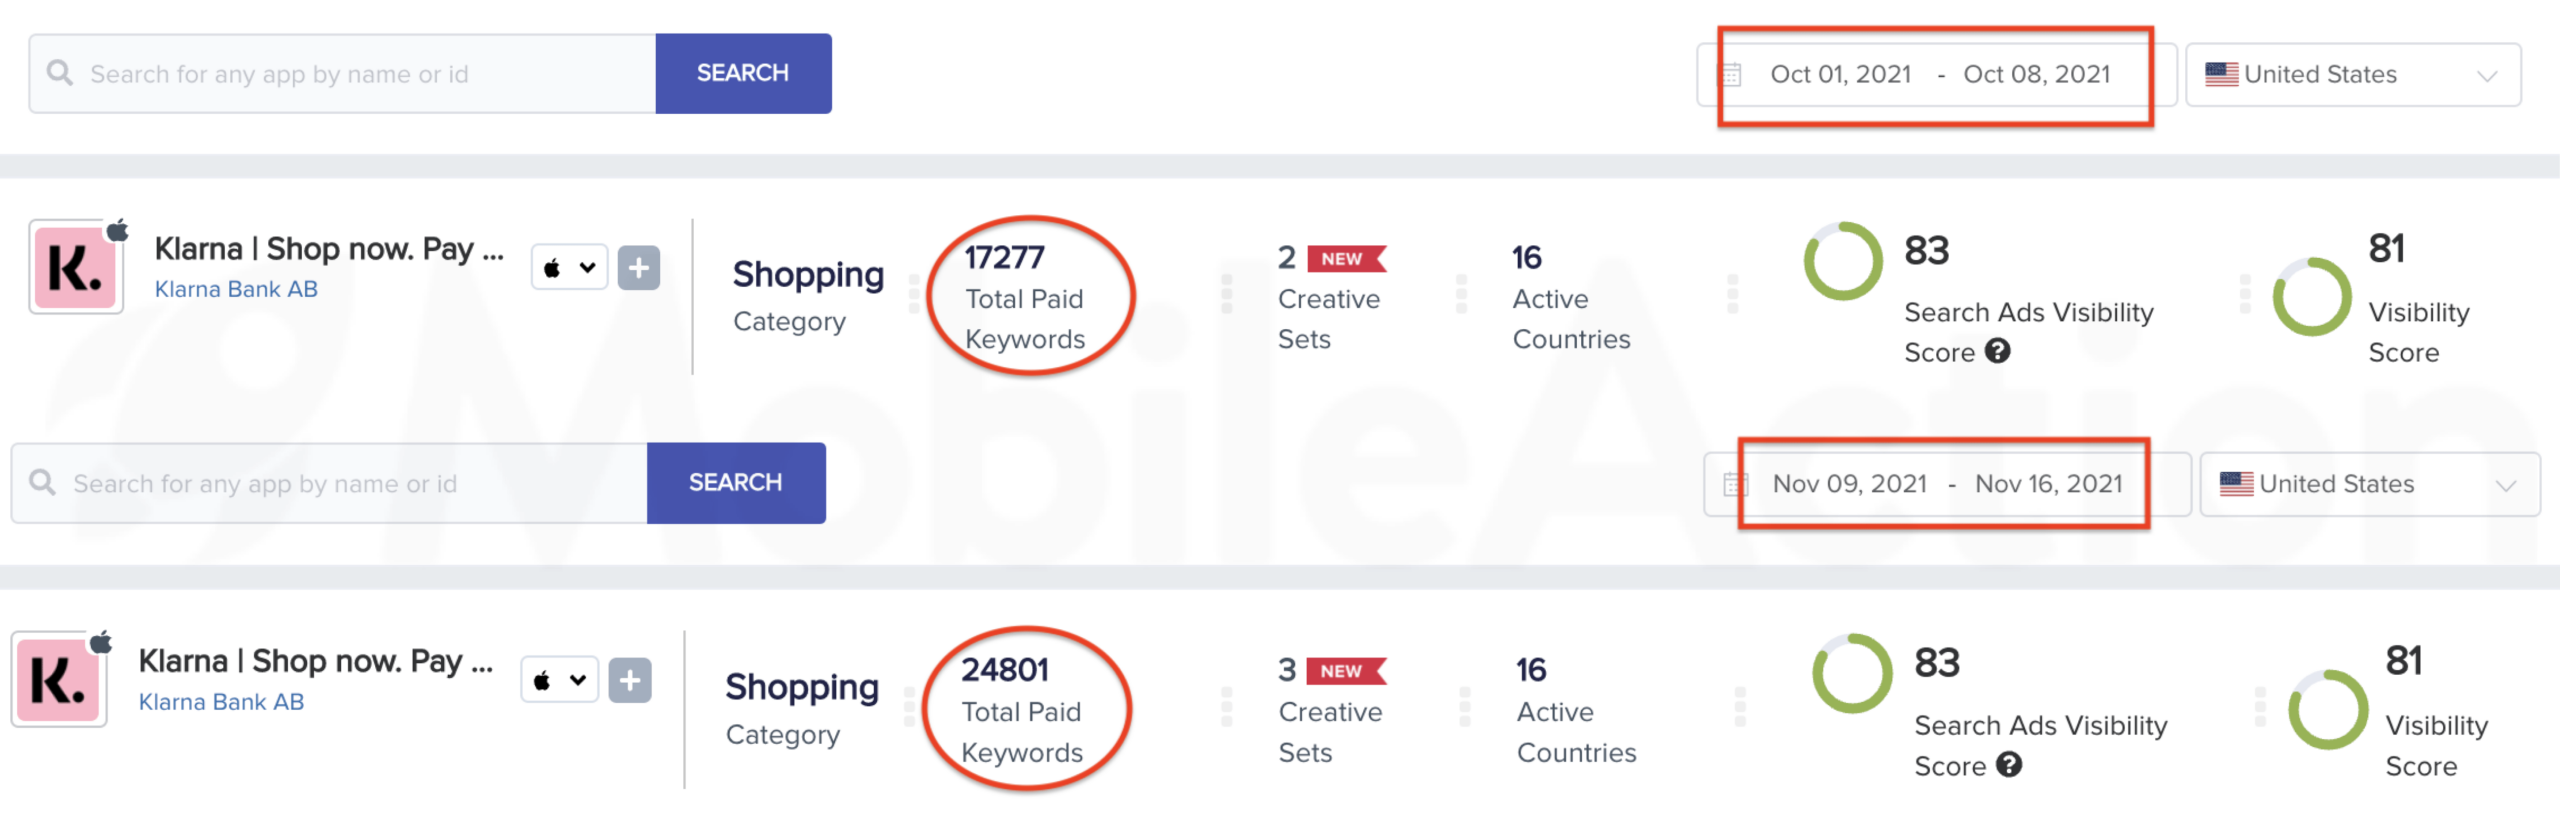
Moreover, when we look at the keyword numbers of other apps, we see that they increased the total number of paid keywords, as Black Friday 2021 approaches. For instance, Klarna was running 17k paid keywords at the beginning of September. Now their keyword count is above 24k, once again displaying the importance of seasonal app marketing.
This is all for the user acquisition strategies of shopping apps during the holiday season. We hope the data we provided will help you take your app marketing strategy to the next level. Meanwhile, you can always schedule a demo with our mobile growth experts and see how you can leverage our peerless mobile app intelligence data to get ahead of the competition.