
“I’ll download this dating app with cool features although there are so few users in it.”
Said no one ever.
The greatest value of a dating app isn’t its cool UI, but it is the community it provides to users. And the most effective way to build this community is through paid marketing.
Today, we’ll uncover the latest dating app ads trends of dating apps by diving deep into paid marketing strategies.
Here are 3 Dating Apps that we will use in our analysis:
Paid marketing strategies of top dating apps: Highlights
In their paid marketing strategies:
- While Bumble prioritized social media channels, LivU and Tinder chose in-app advertising in their paid marketing strategies.
- Bumble directs 33% of its ad creatives to Mexico and the United States.
- Tinder directed its paid traffic only to Italy, Canada, and the USA.
- LivU distributed 3.2% of its ad creatives to Turkey but got the most impressions from Turkey with 24.1%.
- LivU didn’t leverage Apple Search Ads and solely relied on in-app advertising.

Paid marketing 101: Performance tracking and competitor analysis
Paid marketing helps you grow your brand name. This way you expand your community and attract more users.
During this process, you shouldn’t waste money on channels that won’t drive qualified leads to your product pages. You can study your competitors to learn which ad networks and dating app ads creatives they leverage. This way you can uncover the mistakes and the best practices for your paid marketing.
Let’s take a hands-on look at how you can monitor and interpret data by analyzing our selected dating apps.
Find the most profitable ad networks for your app with advertiser analysis
Bumble
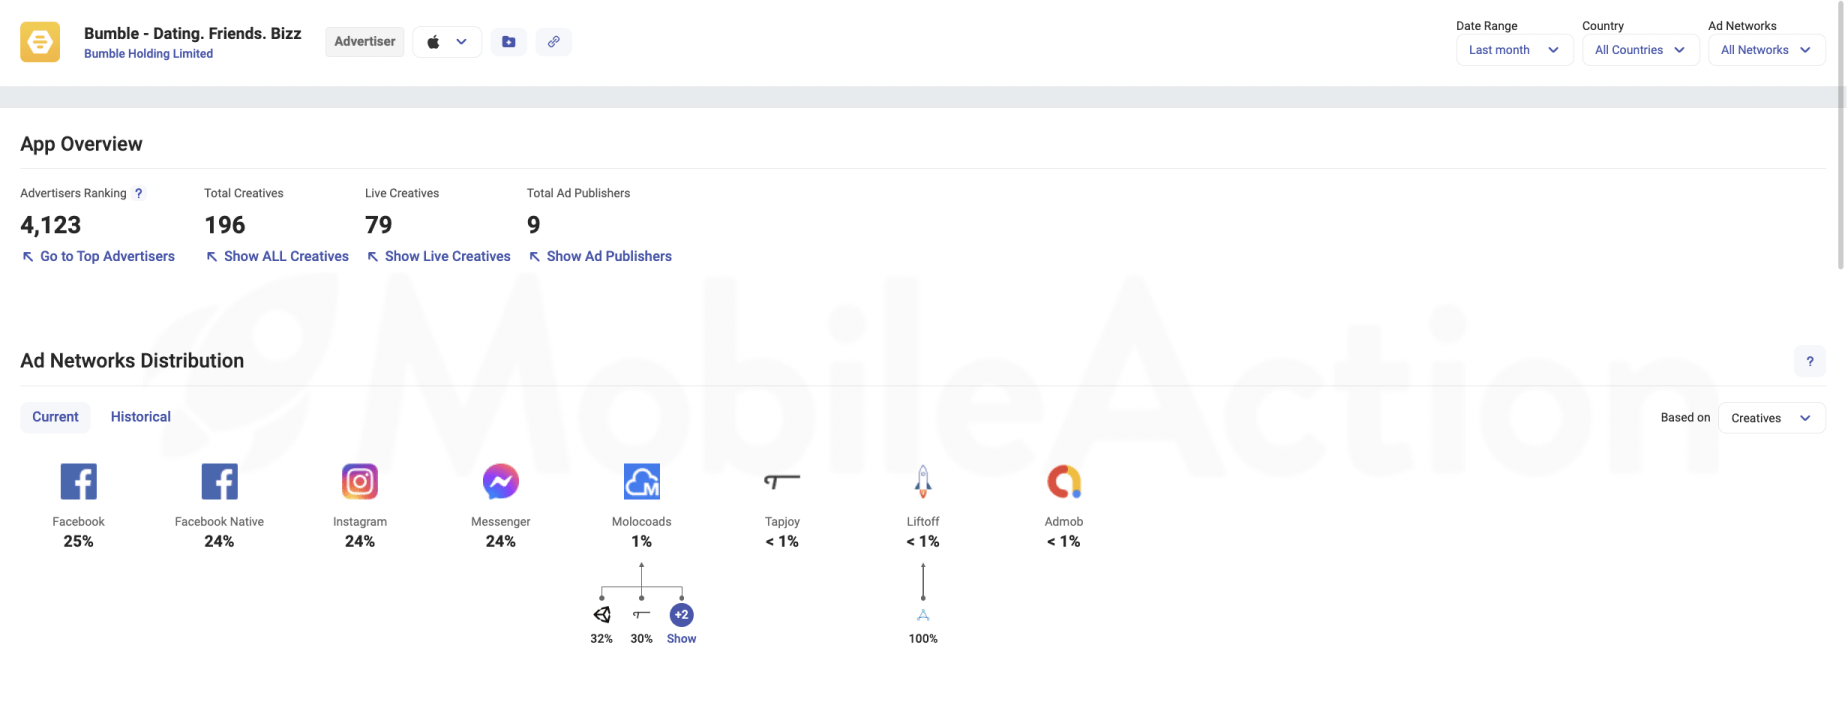
Bumble ran 196 dating app ads last month and decided to keep 79 of them.
- Competitors’ POV: They weren’t happy with the performance of the remaining 117 ad creatives. Let’s analyze their failures and optimize our ad creatives without wasting money on already tried and failed ad creatives.
- Bumble’s POV: We experimented with 196 ad creatives and our success rate was 38%. We can do more market research to detect winning ad creatives, improve the success rate of our experiments and boost our ROAS.
97% of their ad creatives have been distributed to social media channels.
- Competitor’s POV: They’re also trying to expand their brand through social media channels. Let’s benefit from their study to find the most effective channels. This way we can distribute our ad creatives to the right medium and eliminate waste.
Their ad network partners for in-app advertising were Molocads, Tapjoy, Liftoff, and AdMob. Although the Molocads take the bigger cake, we see 30% distributed to Tapjoy.
- Competitors’ POV: Molocads found Tapjoy to be the most profitable option 30% of the time. Since Tapjoy is a well-performing ad network for Bumble, it might work well for us too.
- Bumble’s POV: Tapjoy outperforms other ad networks for our paid marketing. We can drive more creatives and get more out of them.
Tinder
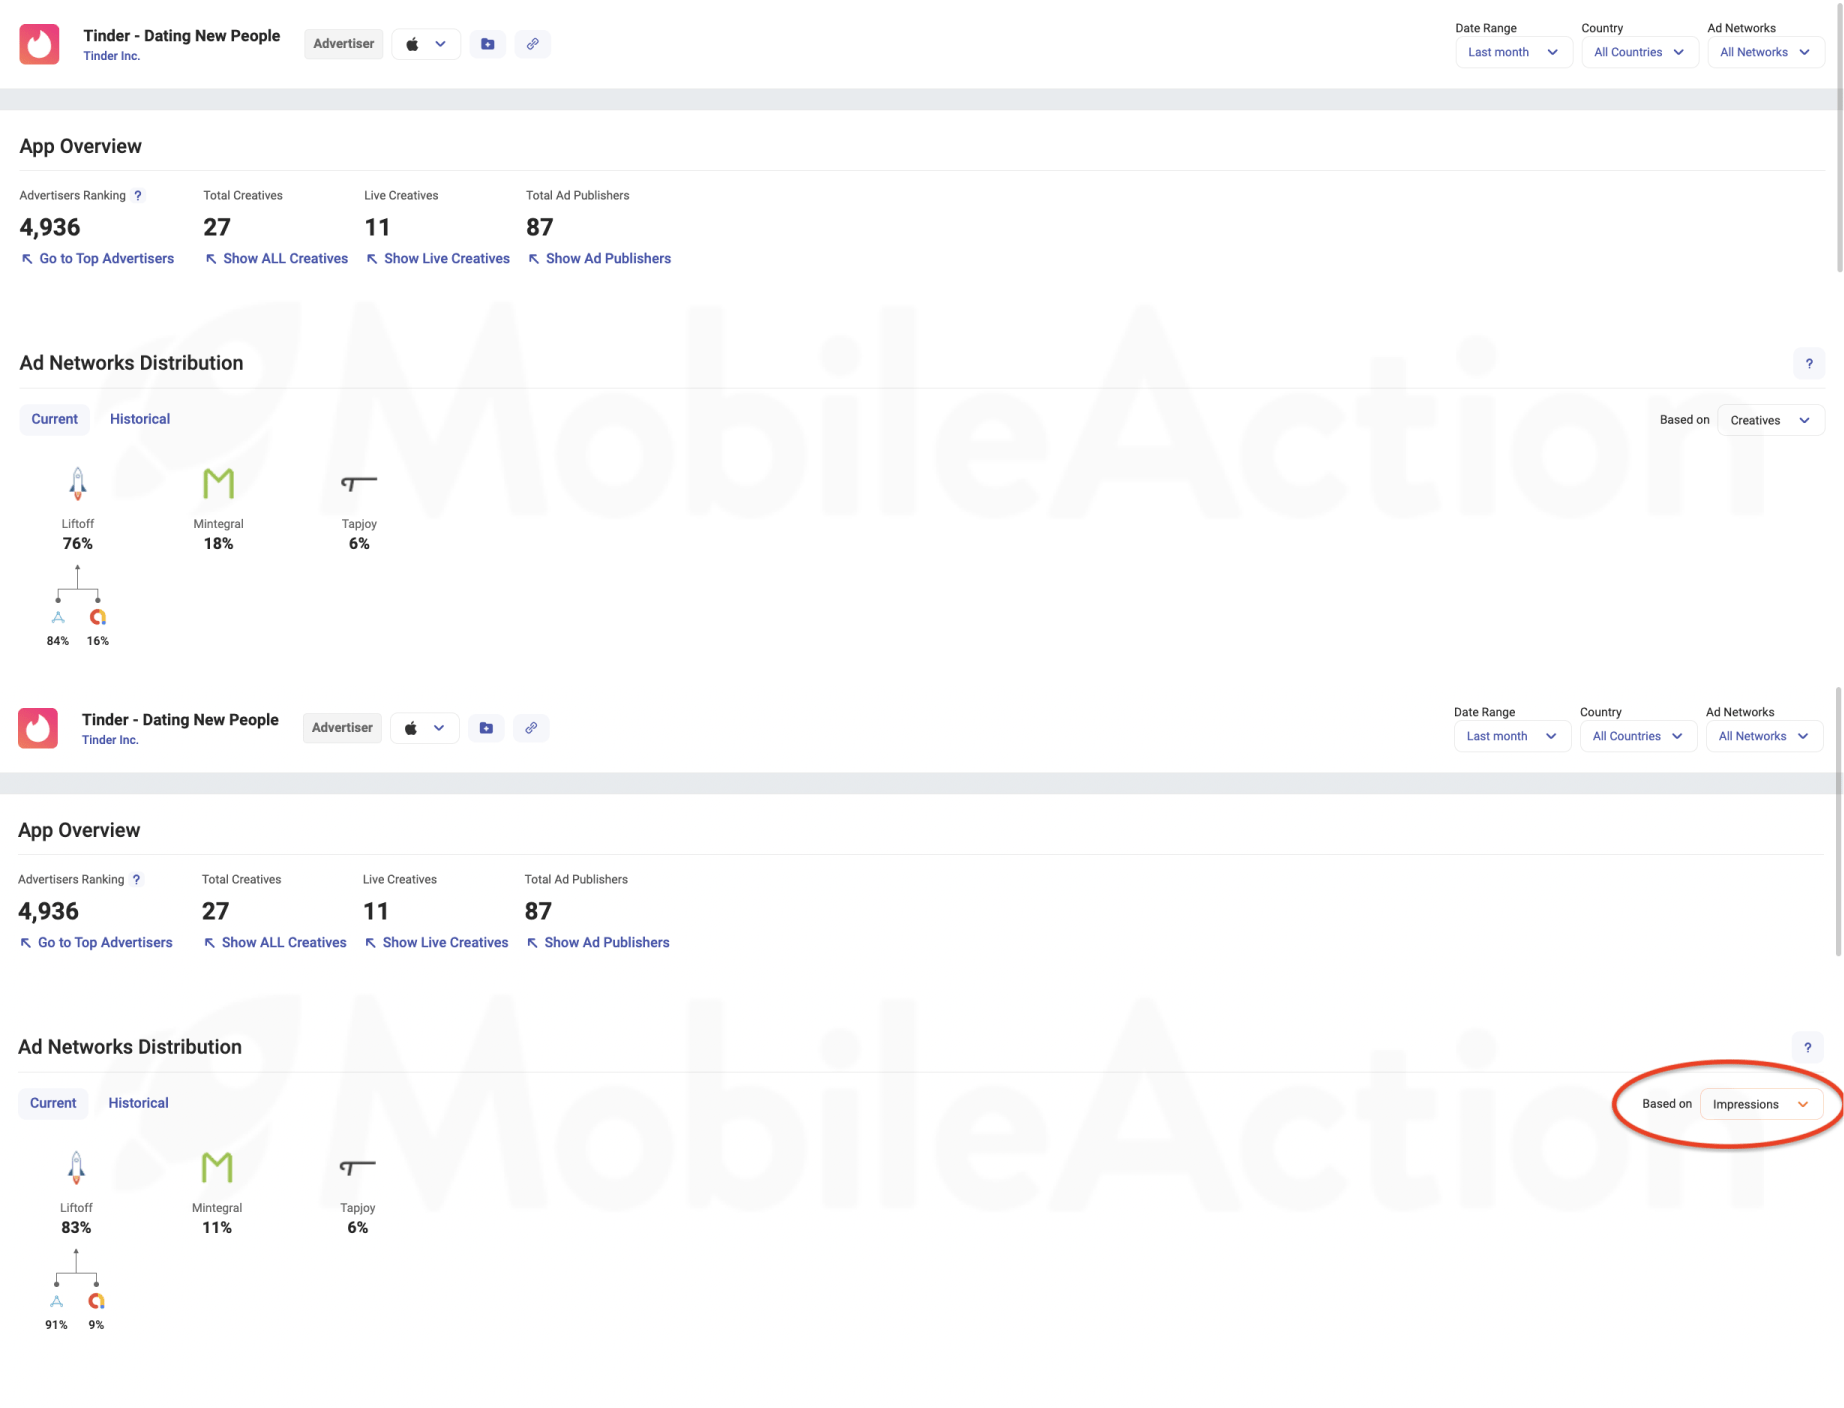
Tinder didn’t include social media channels in its paid marketing strategy and distributed 76% of its creatives to Liftoff. This share was divided between Applovin and Admob because Liftoff’s found these two channels the most profitable at the time.
Although they distributed 18% of their ad creatives to Mintegral, only 11% of impressions came from this partnership.
- Competitors’ POV: Tinder focused only on in-app advertising, and here are their ad networks. While Applovin performed well for them, Mintegral did not bring the desired results. Therefore, we can add Applovin to our paid marketing strategy to manage our budget more efficiently.
- Tinder’s POV: Mintegral is underperforming for our paid marketing campaign. Let’s test out another ad network to find a better option and improve our ROI.
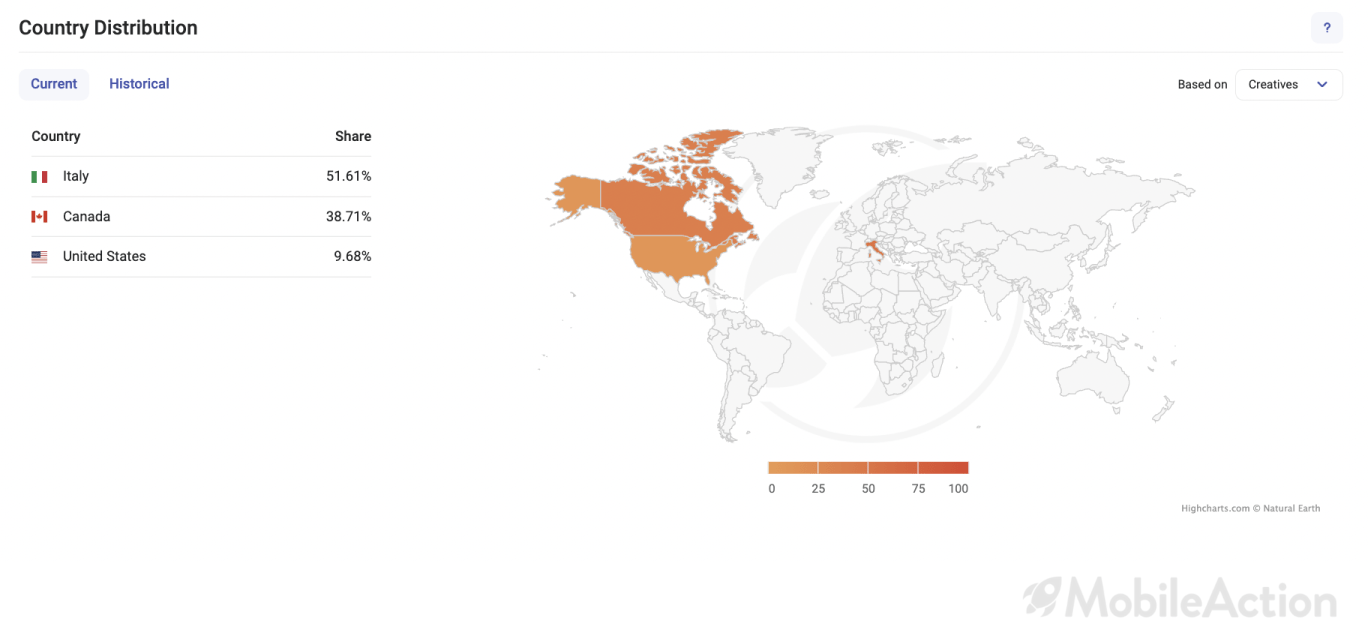
Half of their dating app ads creatives were for Italy, followed by Canada with 38% and the US with 10%.
- Competitors’ POV: Tinder aims to expand its user base in Italy. If Italy is on your target storefronts list, you can analyze how Tinder engages with Italian users and build your paid marketing strategy faster.
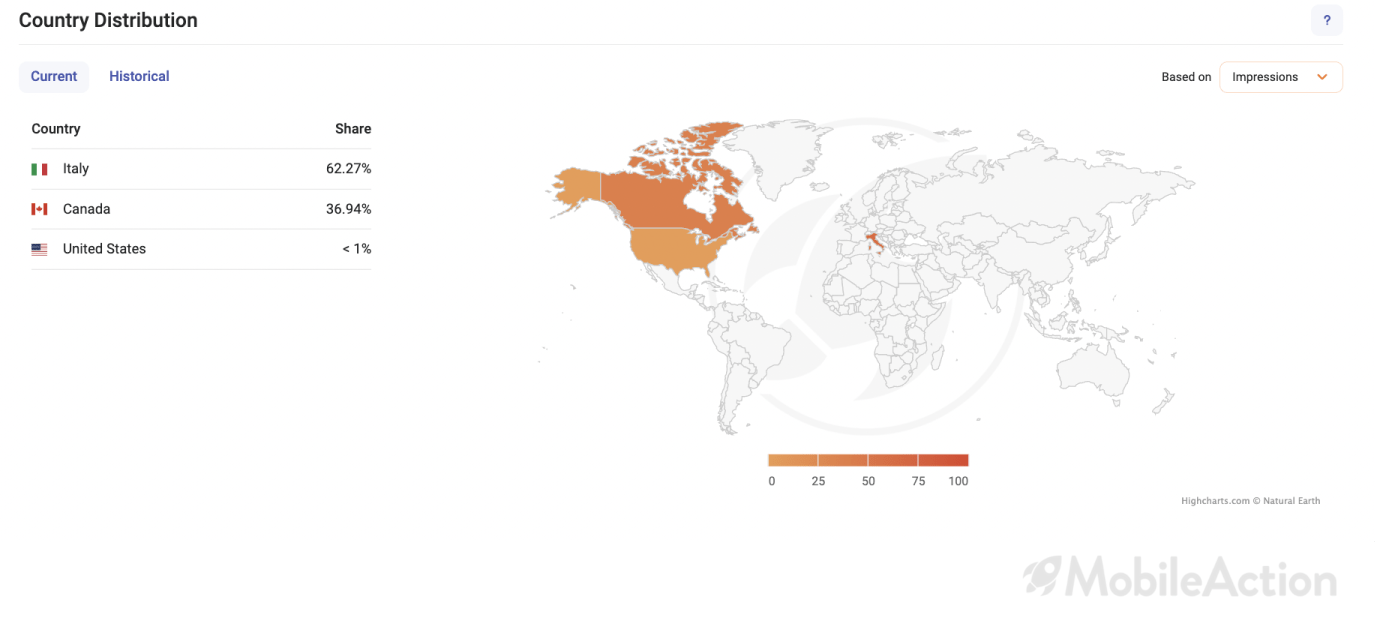
Although 10% of Tinder’s dating app ads creatives were distributed to the U.S, Tinder received less than 1% of its total impressions from this storefront.
- Tinder’s POV: Our ad creatives don’t get impressions in the U.S. We should diversify our approach, try new channels, or target other storefronts that might be more profitable.
LivU
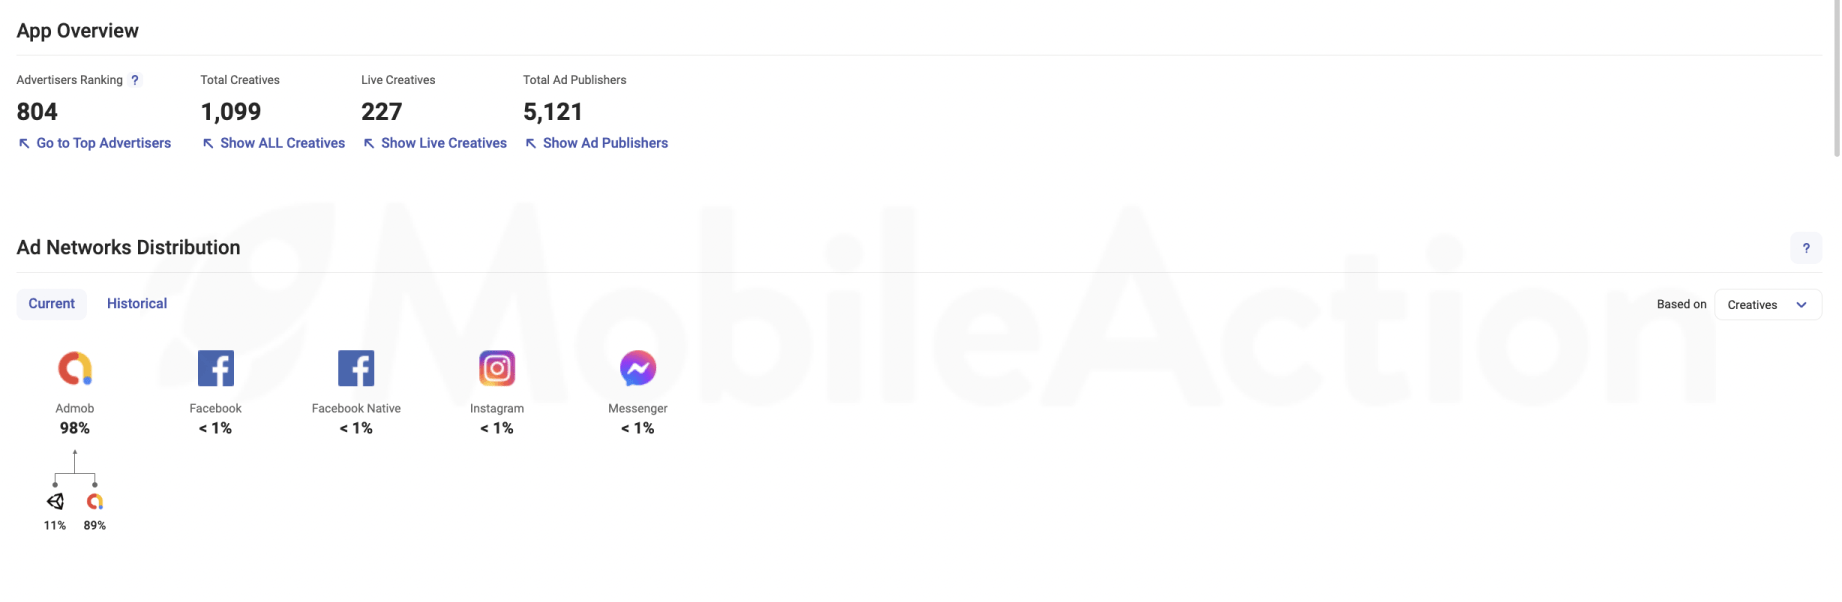
LivU prioritized in-app advertising in its paid marketing strategy but also drove 2% of its ad creatives to social media channels.
- Competitors’ POV: They seem to be testing impact as they drive 2% of creatives to social media channels. Let’s follow their experiment to learn from their work and optimize our marketing for less cost.
LivU is the most aggressive advertiser among these dating apps. Last month, they ran 1099 ad creatives in total, and only 227 of them survived the A/B testing of LivU.
- LivU’s POV: We seem to spend on ad creatives that don’t engage users. We should experiment with better ad creatives by studying the market and our audience to increase our ROAS. Or maybe we shouldn’t solely rely on in-app and social media marketing. We can try to boost our downloads by leveraging Apple Search Ads since 70% of downloads come right after the search.
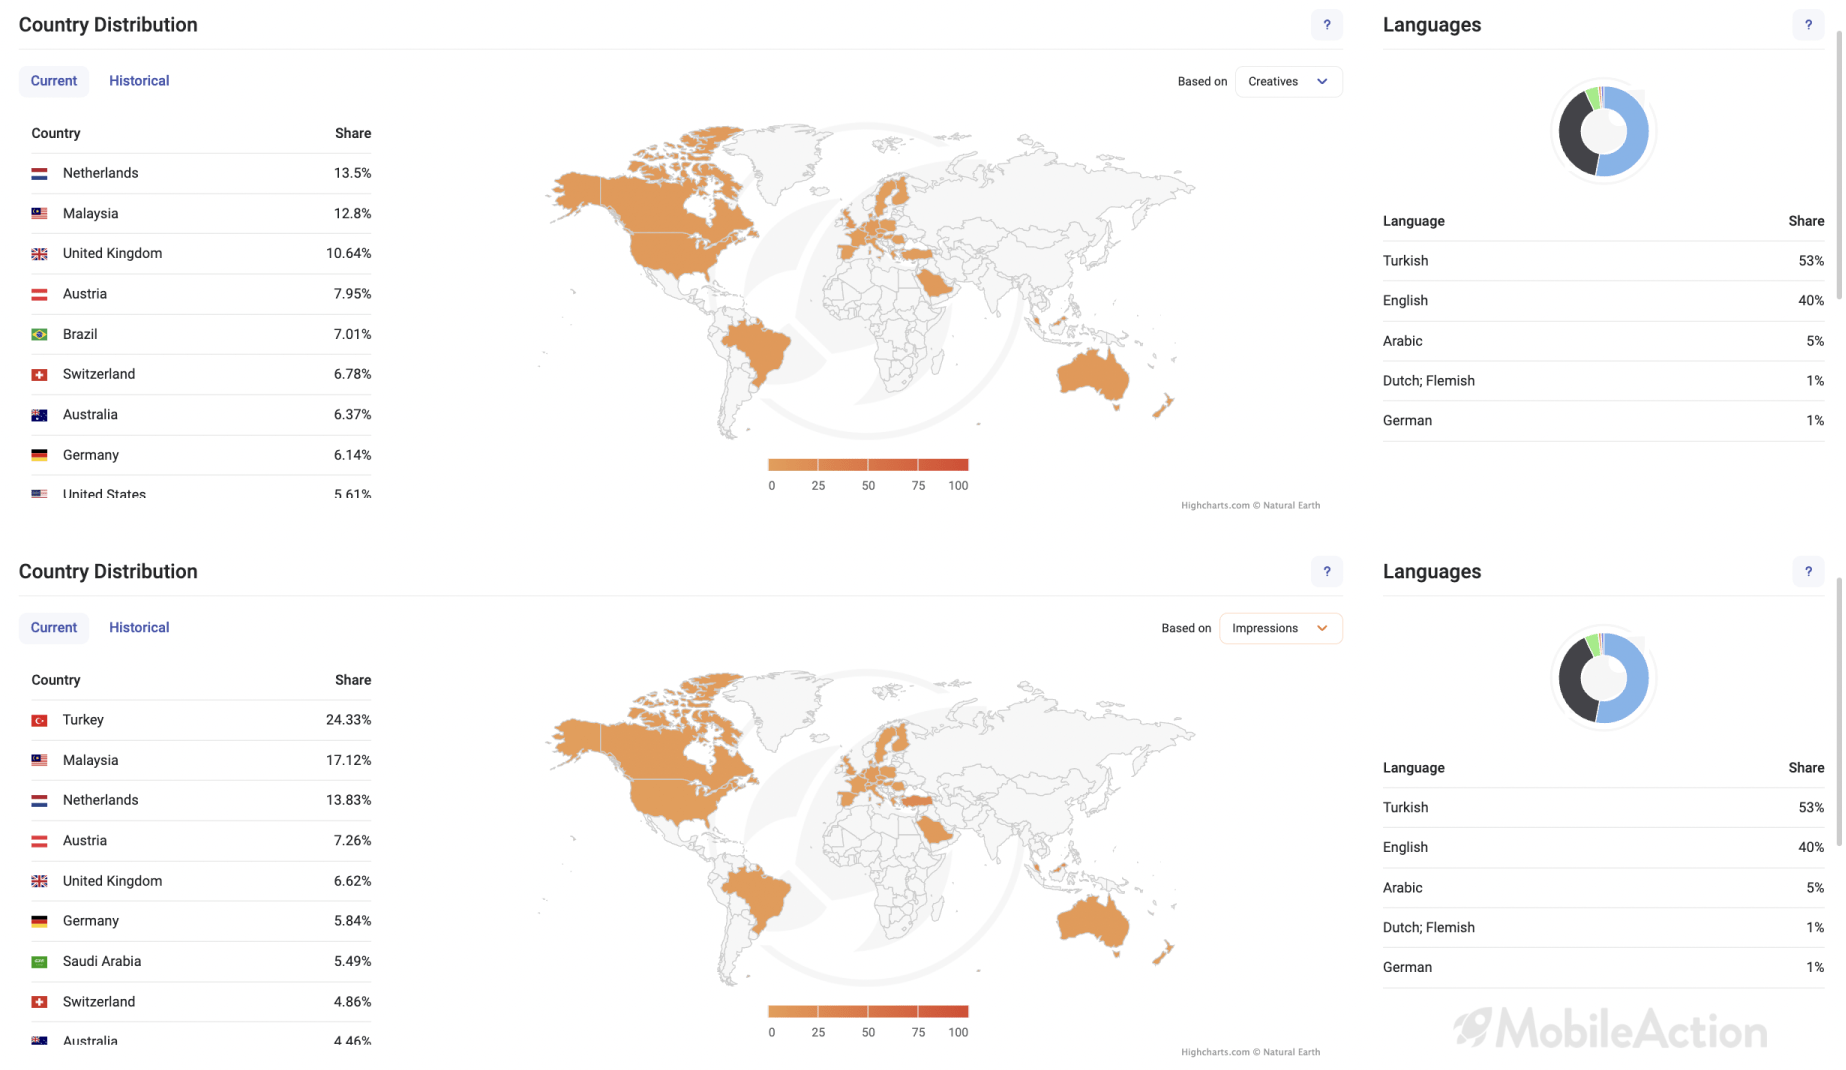
Their main target seems to be Europe, as they direct almost half of their creatives to European countries. Even though 3.2% of the creatives were distributed in Turkey, they received the most impressions there.
- Competitors’ POV: Turkey seems to be a high-yielding storefront. We can drive ad creatives there and increase the paid traffic to our product pages.
- LivU’s POV: We heavily target the Netherlands but can’t get enough impressions. We should find different channels or try to localize our paid marketing to get better results from our target storefront.
Optimize your tap-through rates with creative analysis
We identified the best ad networks and storefronts for our paid marketing campaigns. Now, let’s do research on dating app ads to improve Tap-through rates (TTRs).
Bumble
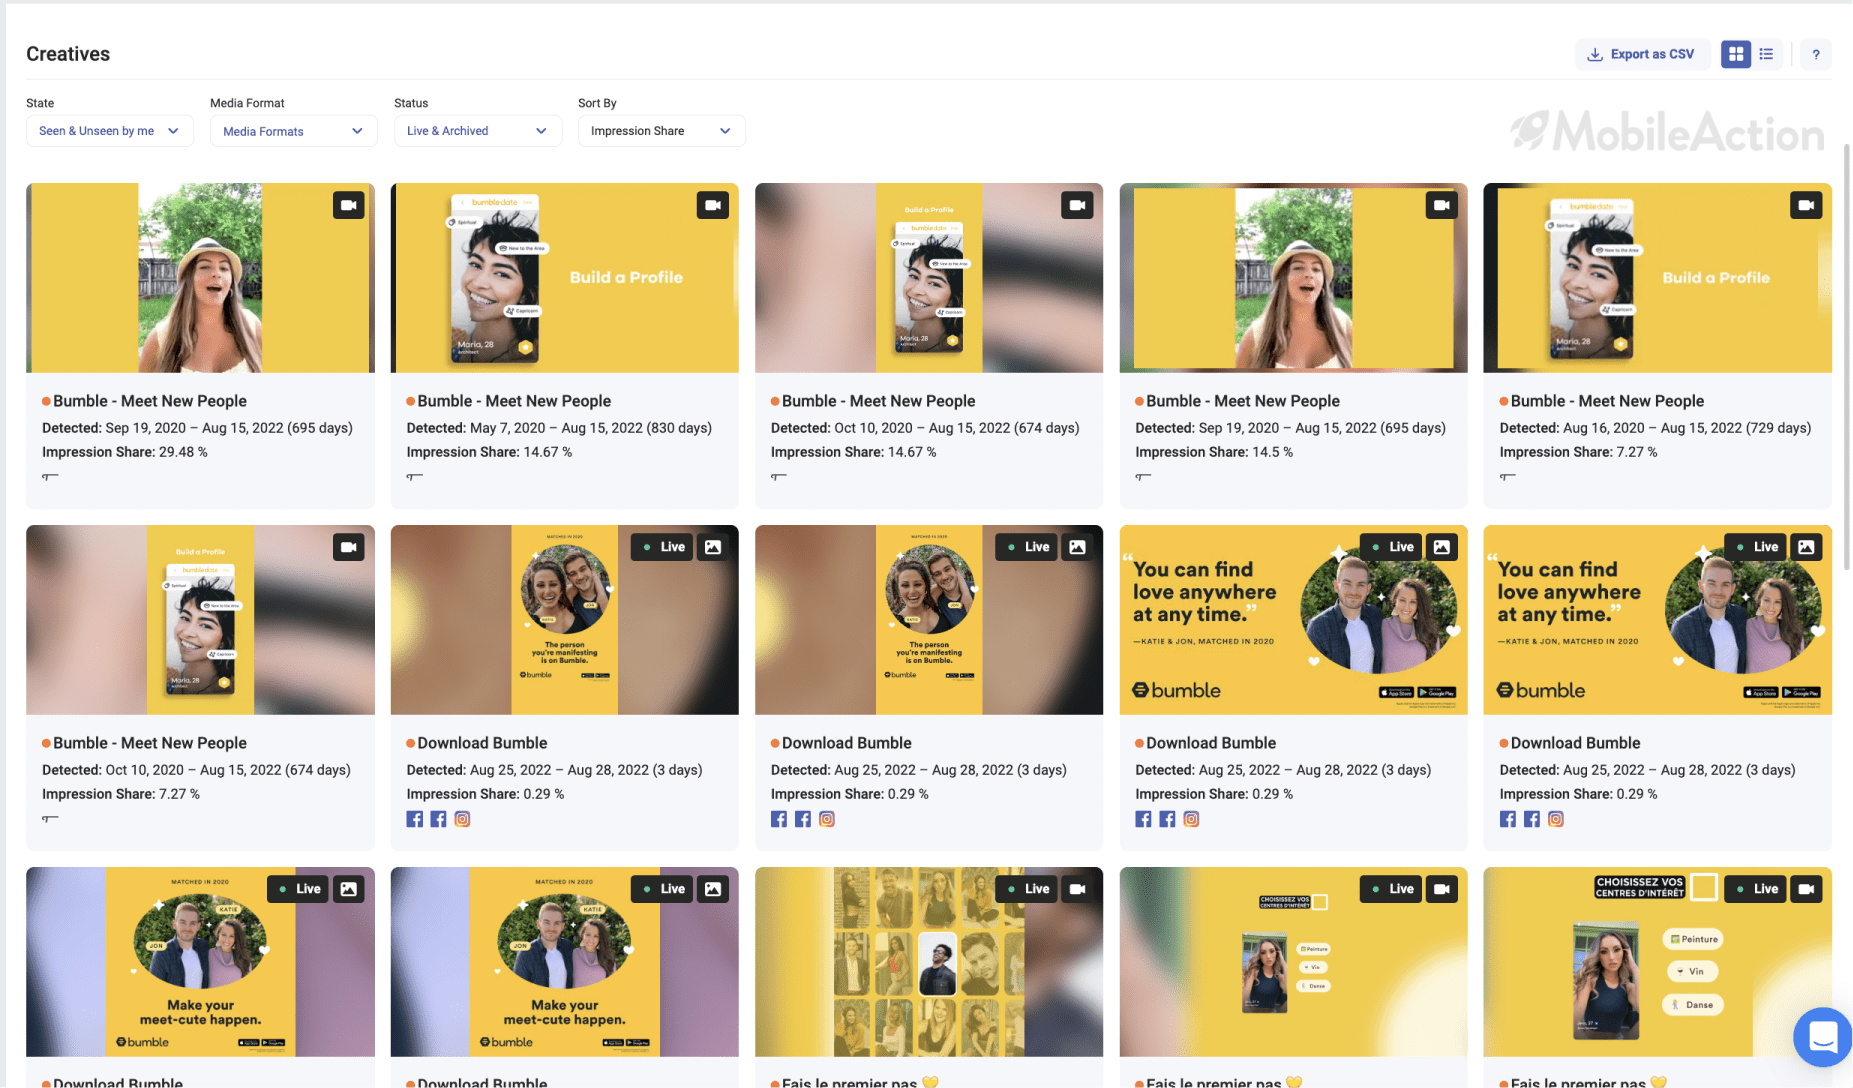
Here we see top-performing ad creatives of Bumble. We filtered the search to see all media types, live and archived, and sorted by impression share.
The first thing we saw is Bumble decided to revise its dating app ads. They removed their old ad creatives that have been live since late 2020. Let’s see what they changed.
- They were using this ad creative for in-app advertising.
- It was a short video focusing on one value proposition: “ Find Dates”
- “How to find dates” was a bit left in the air.
- The message was clear even if users watched without the sound.
- They changed the structure. The visual looks more engaging now.
- They covered “how to find dates”.
- They directed this ad creative to the social media channel.
- They localized the ad creative for France.
Here’s everything Bumble got right with these creatives:
- It now explains the whole process.
- It is now localized to target a specific audience.
- It can reach more relevant audiences with social media channels.
These improvements will expand the reach AND increase the conversions.
It’s that easy to uncover best practices and the latest ad trends. All you have to do is leverage MobileAction’s Ad Intelligence.
Optimize your ROAS with Apple Search Ads
The best time to approach users is when they are most inclined to download. This is why you should leverage Apple Search Ads in your paid marketing campaigns.
Let’s see How Tinder approach Apple Search Ads.
Tinder
Tinder bids on almost 2900 keywords and they get the highest impression share for the most important generic keyword.
Dating.
Tinder has dominated the impression share for this keyword for a while. Therefore, they are probably dominating the download volume coming from this keyword, too.
Here’s how this benefits Tinder:
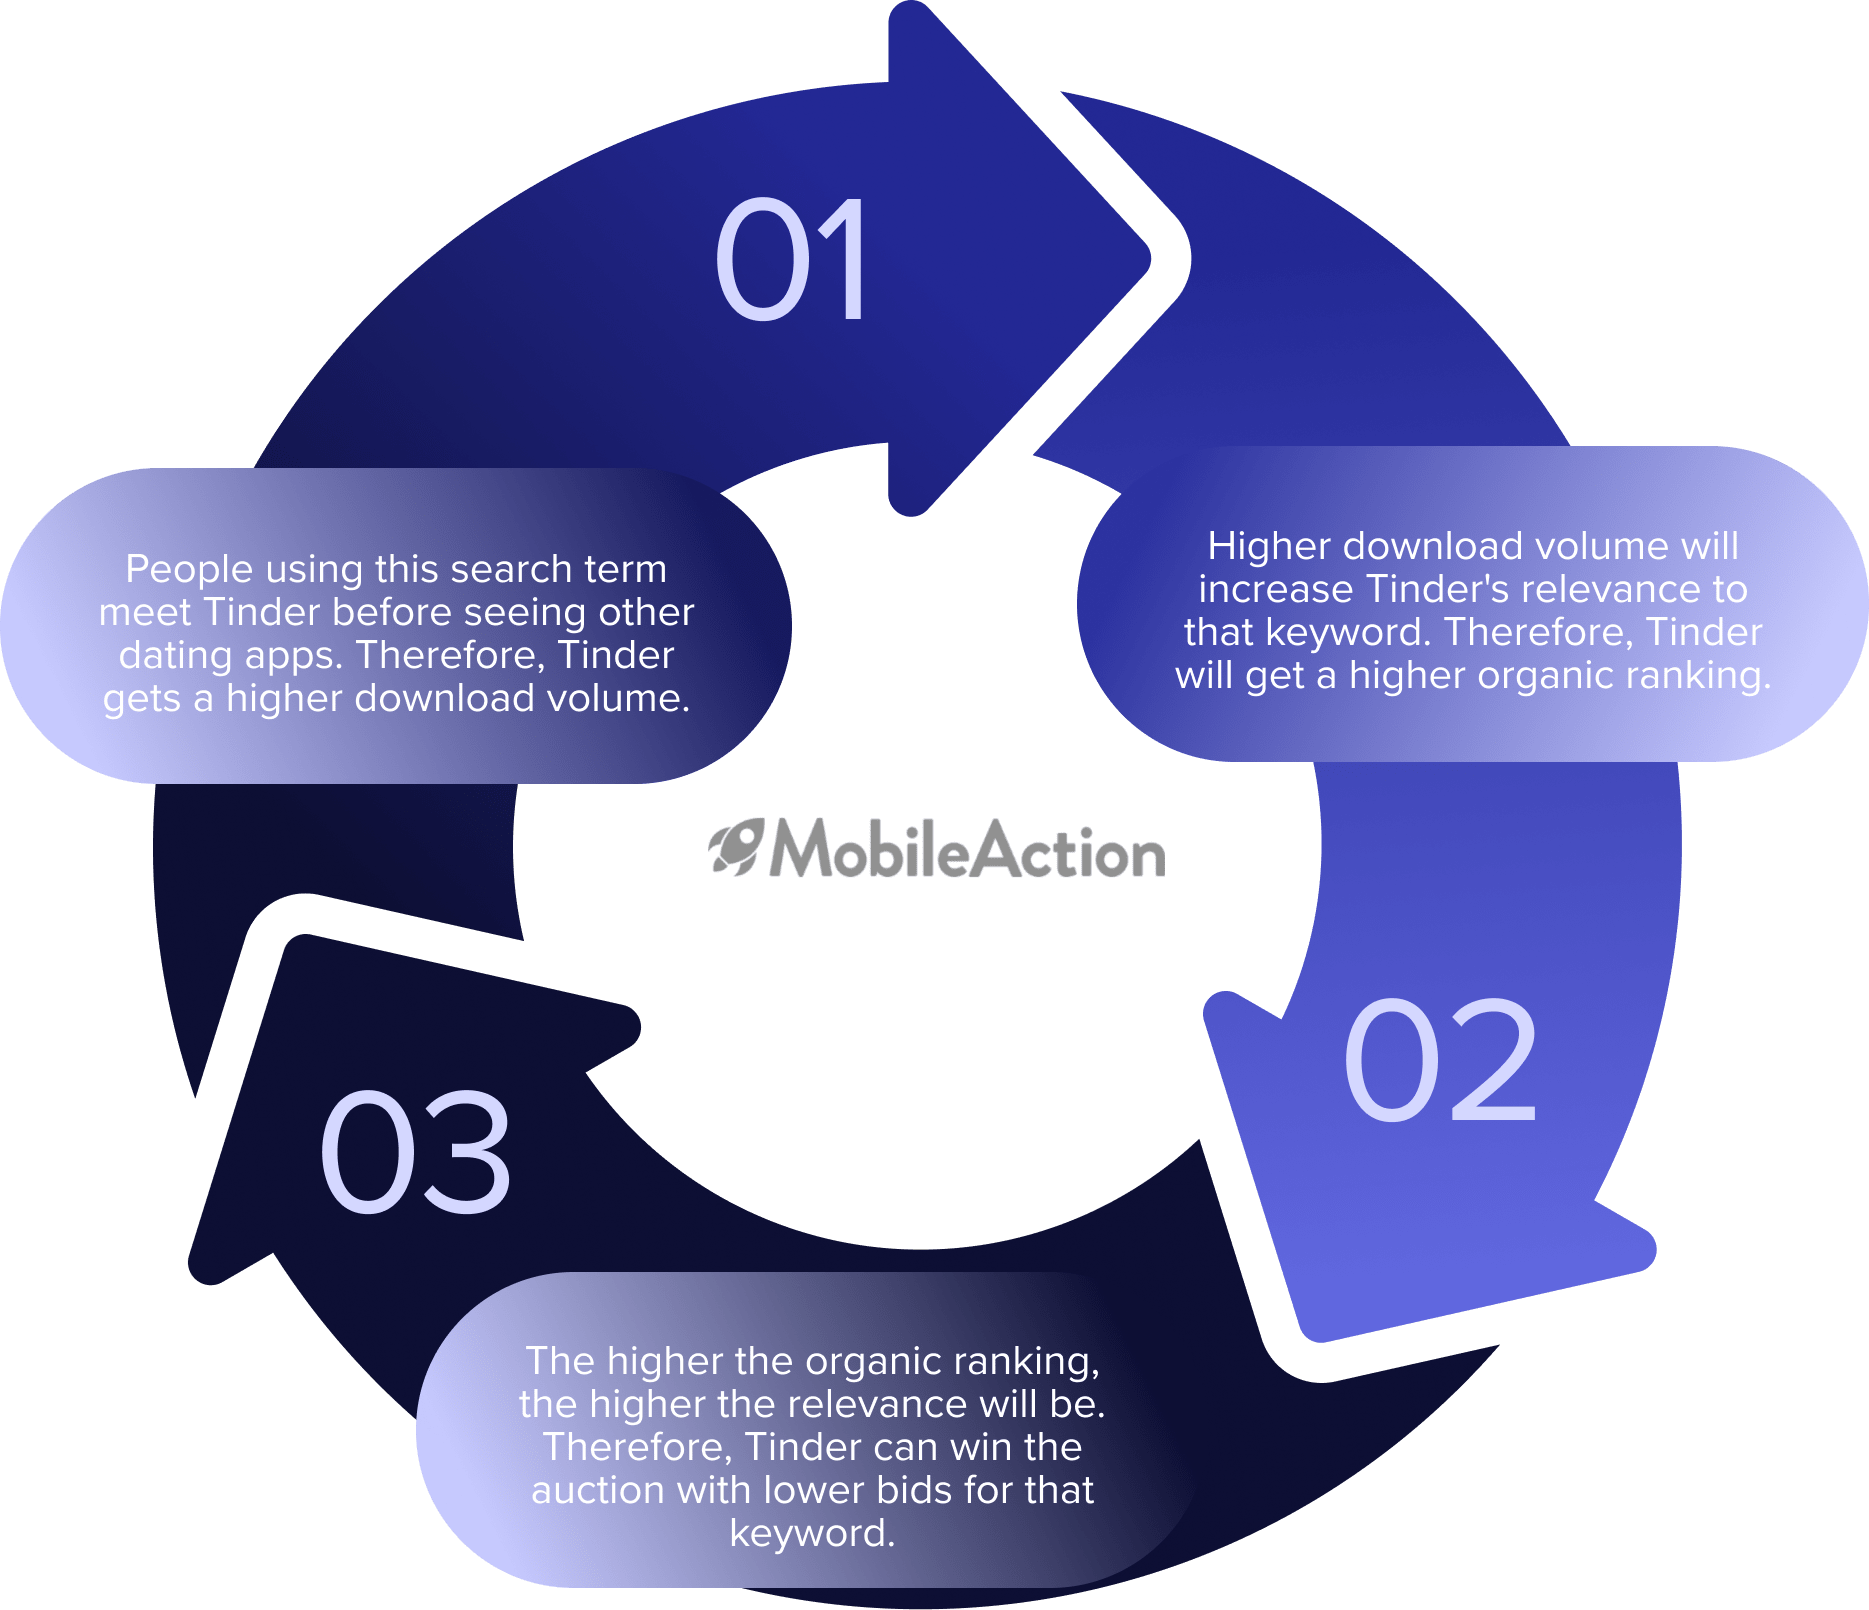
Apple Search Ads and App Store Optimization are interrelated. If you do well in one of them, you’ll do better in the other.
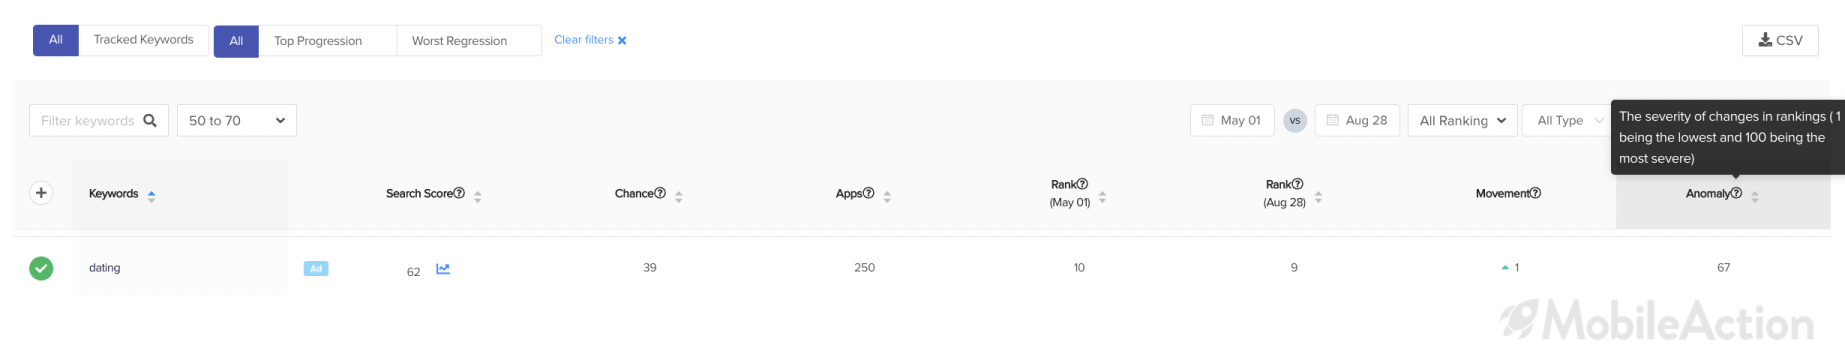
The anomaly score is 67 which indicates how severe the changes in ranking for this keyword are.
As seen in the ASO Report above, Tinder has improved its organic ranking on this highly competitive keyword during the same time period. This is why you should leverage ASO and paid marketing together to maximize your mobile growth.

With MobileAction you can:
- Improve TTRs by uncovering the latest ad trends
- Identify where your campaigns fall short and shift your budget to the right channels
- Eliminate waste by learning from your competitors’ experiments
- Boost your Mobile Growth by leveraging ASO and Apple Search Ads in the most profitable way
You can book a demo with our experts to learn more about how we can optimize your paid marketing campaigns.