In our Visibility report update post and Visibility analysis post, we have talked about why visibility is a crucial step in ASO if you want your app to succeed. If you haven’t, you can give them a read to better understand.
Let us dive deeper this time by comparing two apps, and seeing just how much of a difference it can make if you want to get ahead of competitors.
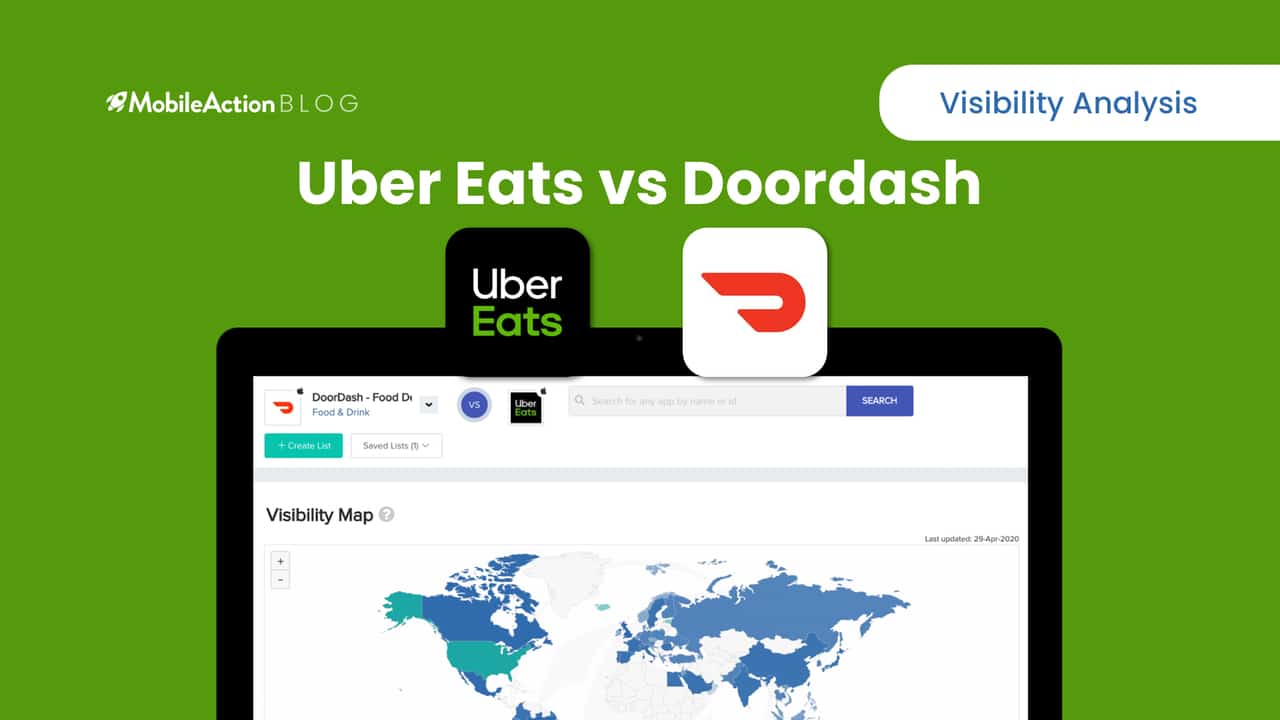
We have chosen two apps to analyze over, so let’s talk about them a bit first. Not because I’m starving right now but because everyone’s still stuck at home thanks to the coronavirus, delivery might be one of the few businesses that have been able to turn the situation upside down. So let’s use two of the popular delivery apps from the Food and Drink category. We will use DoorDash and Uber Eats for our examples.
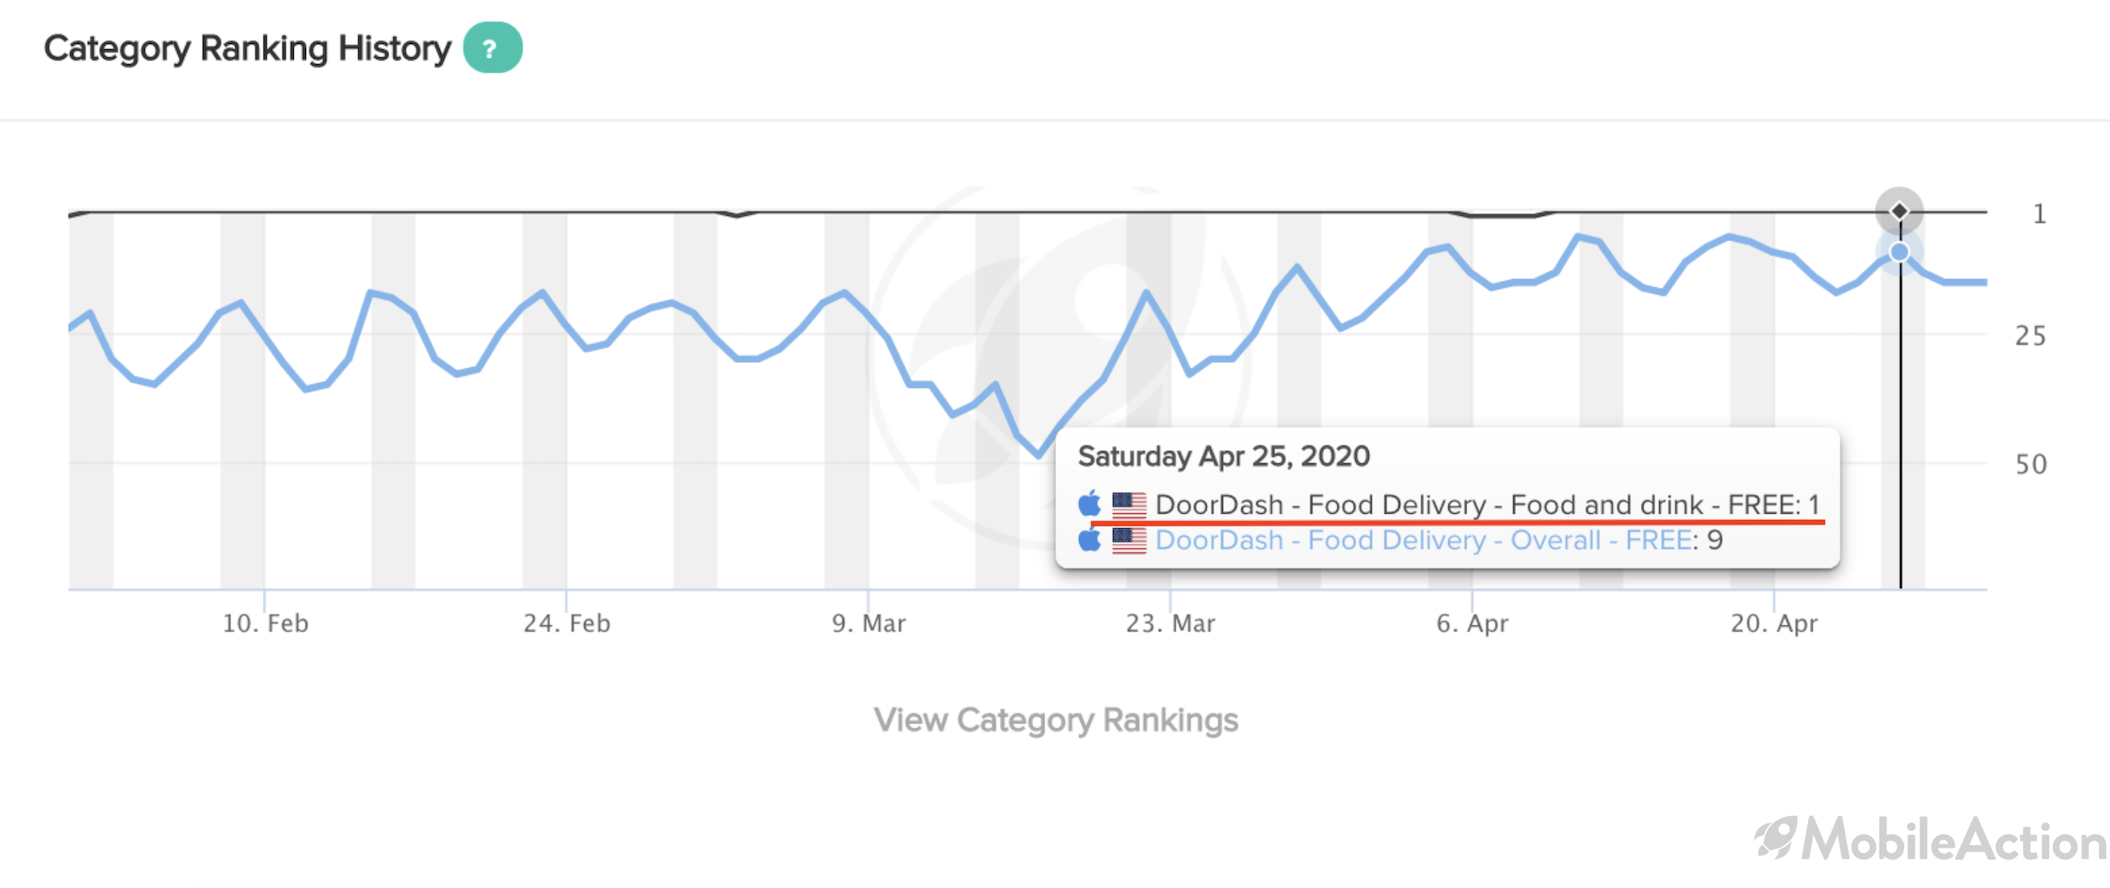
DoorDash Food and Delivery is USA based. When we select the time frame for 3 months, we can see that in Category Ranking History, which shows the category and overall rankings of your app for the selected country and date range. Door Dash is the 1st in its own category and in all categories, the lowest it has been was 49th, and the highest was 6th. As of April 25th, it ranks as 9th.
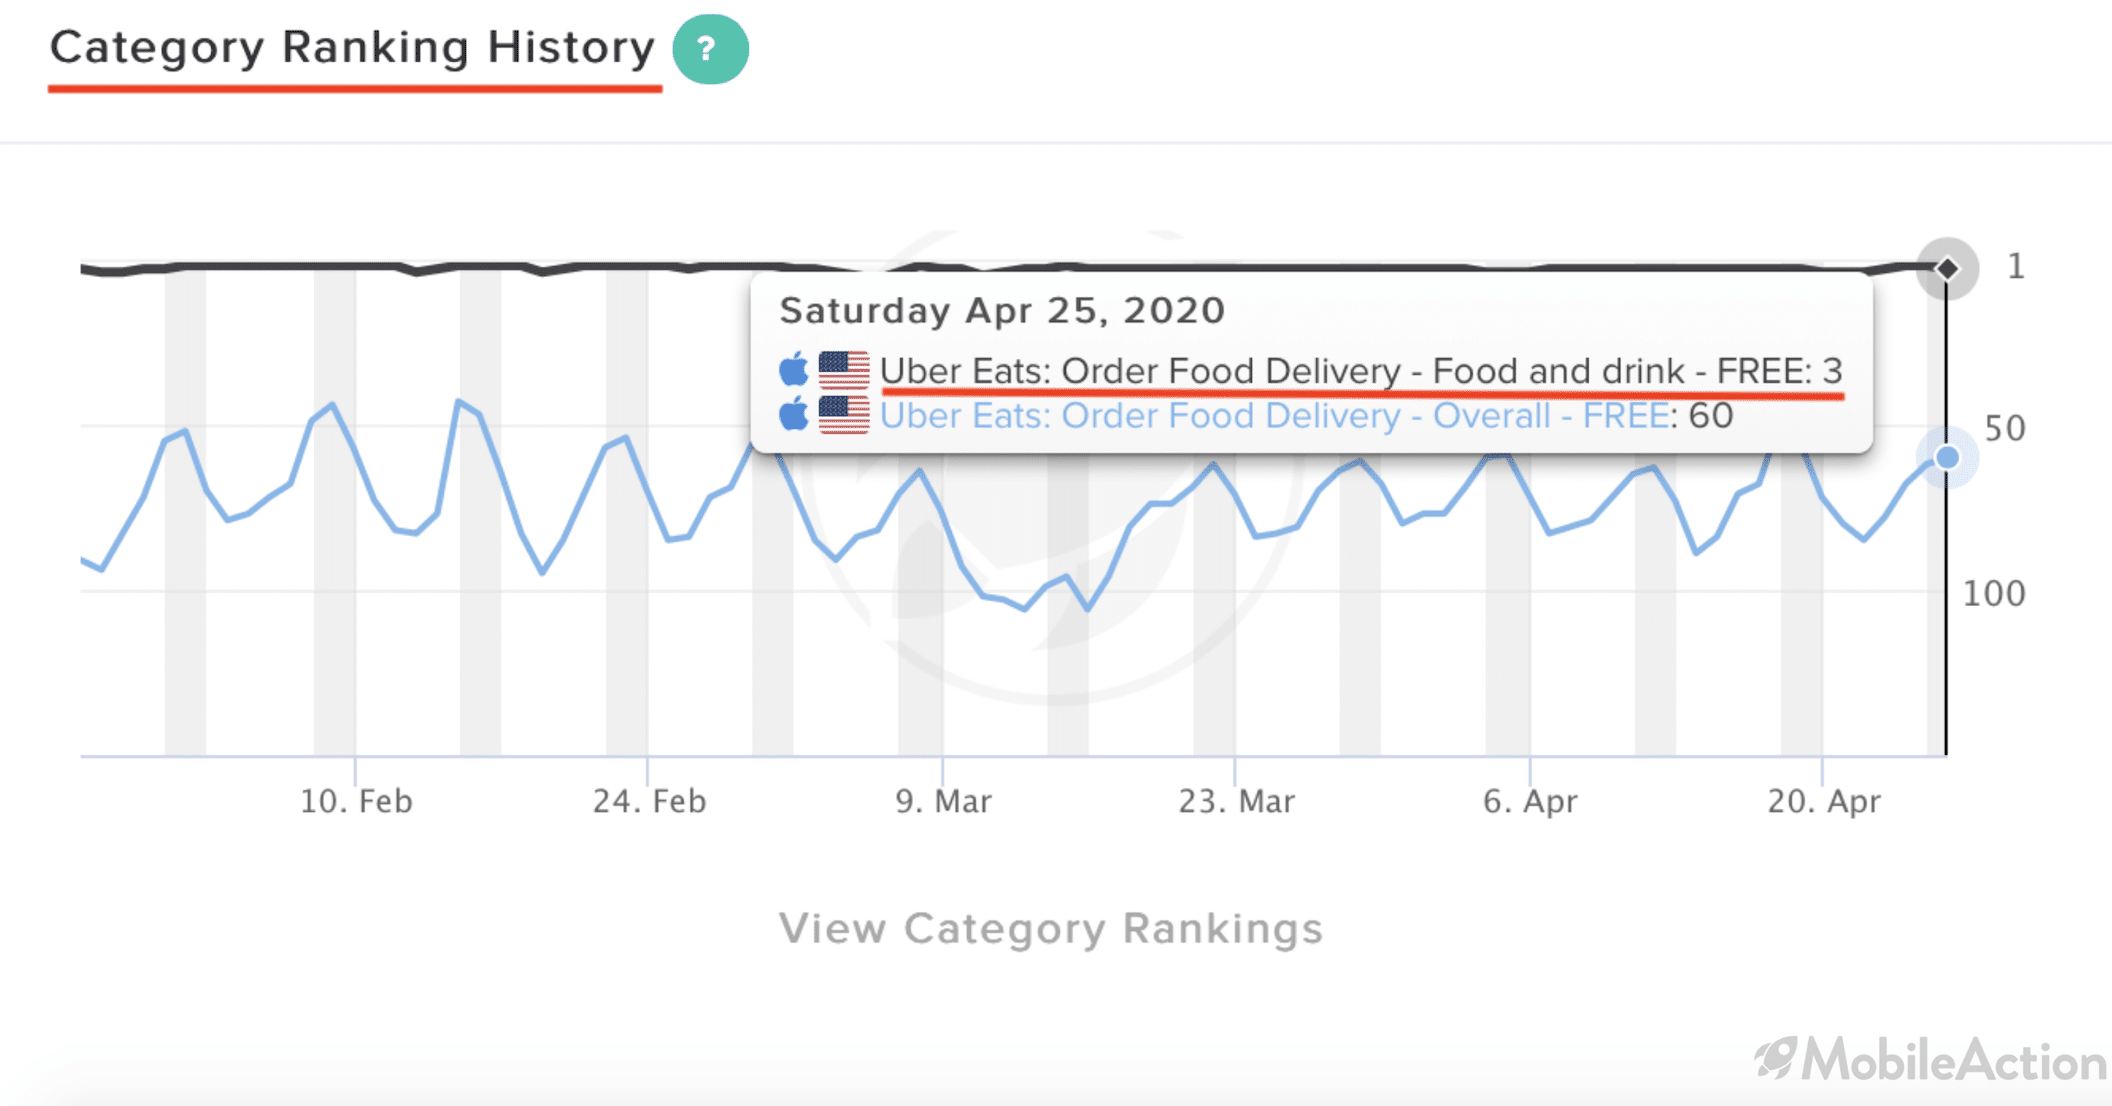
Another app is Uber Eats: Order Food Delivery, again USA based. When we look at its data for the past 3 months, it was fluctuating between 3rd and 6th in its own category. And in overall lowest it’s been was 106th, the highest was 6th and as of April 25th, it ranks as 60th.
We’ve looked at these apps category ranking and got an overall understanding of where they stand in the charts. Now, let’s take a look at how they’re doing with Visibility to get a deeper understanding.
Visibility Around the World
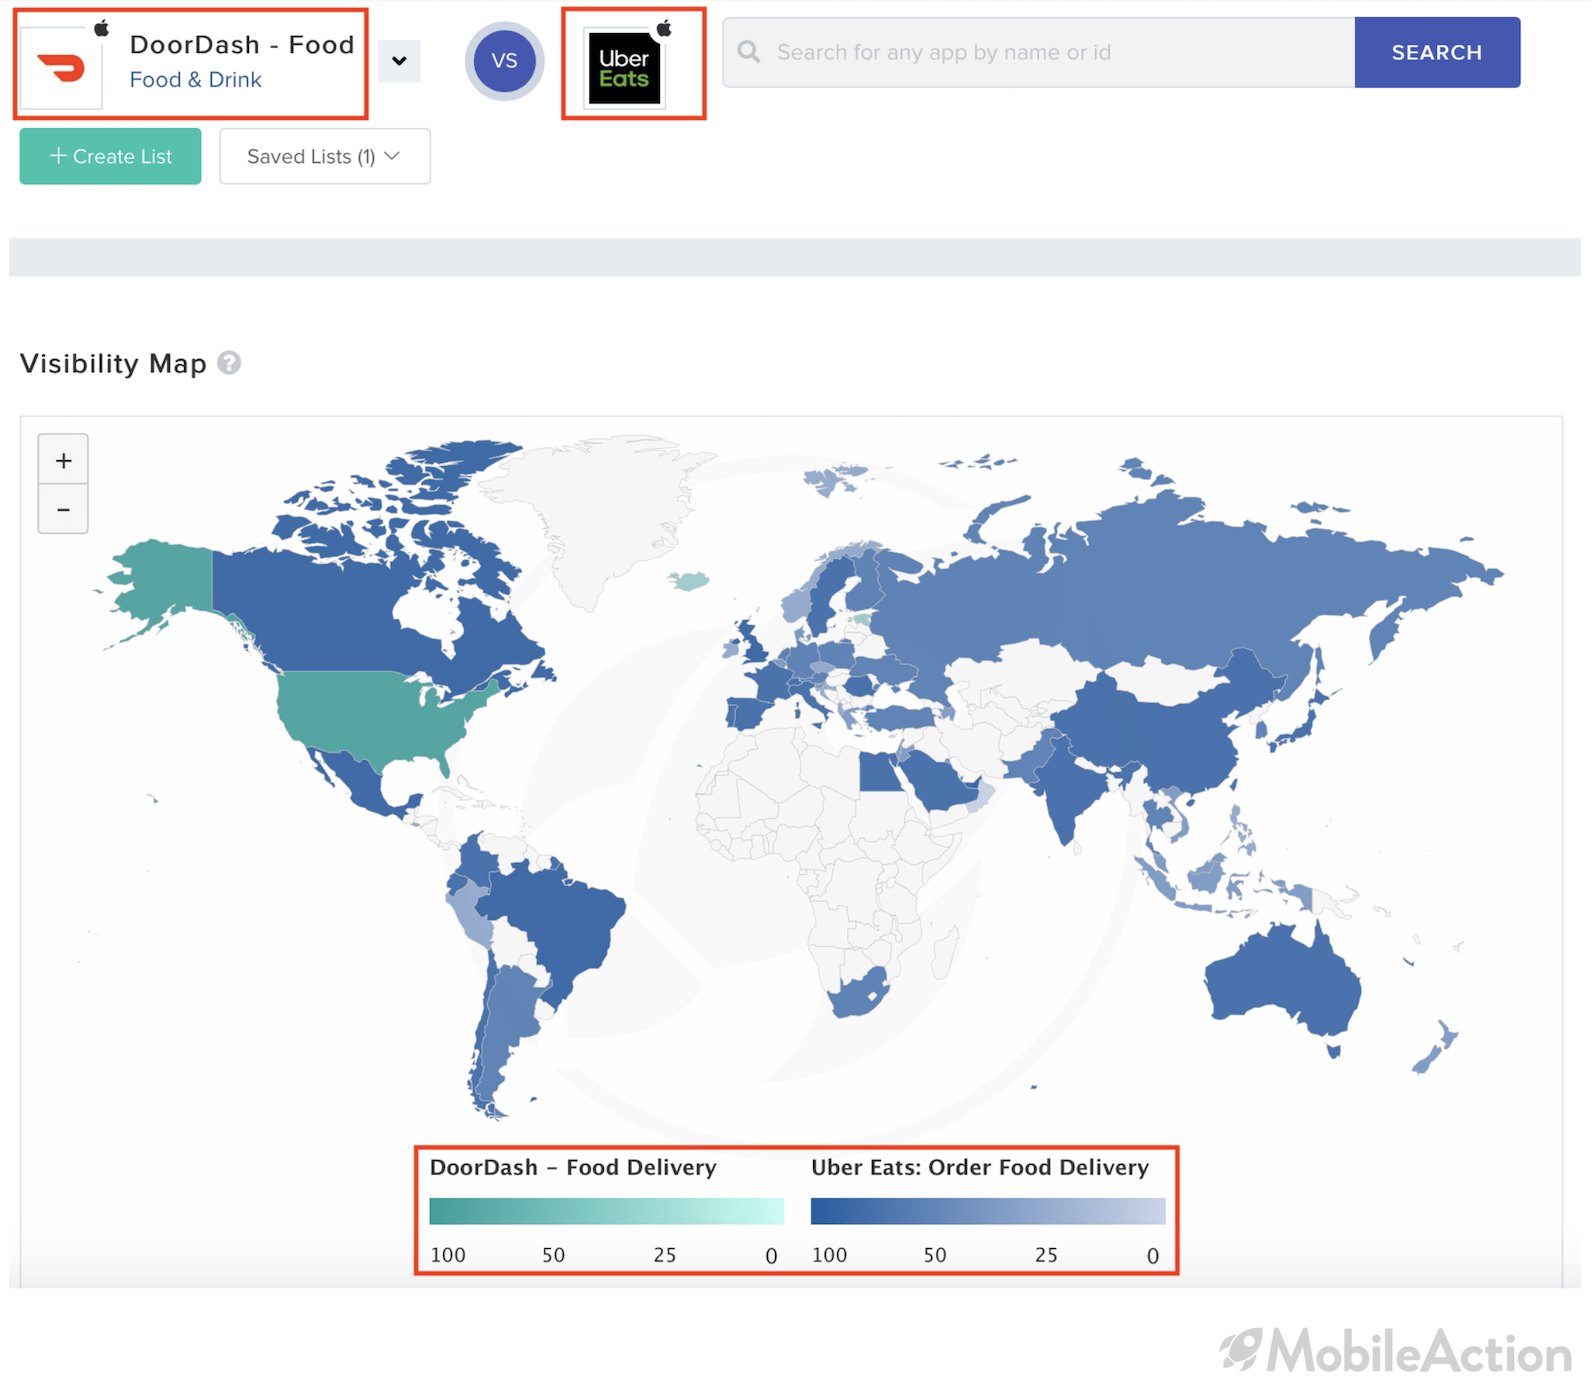
As we have talked about in the previous Visibility Analysis on 7 Minute Workout, the darker the color the higher the visibility.
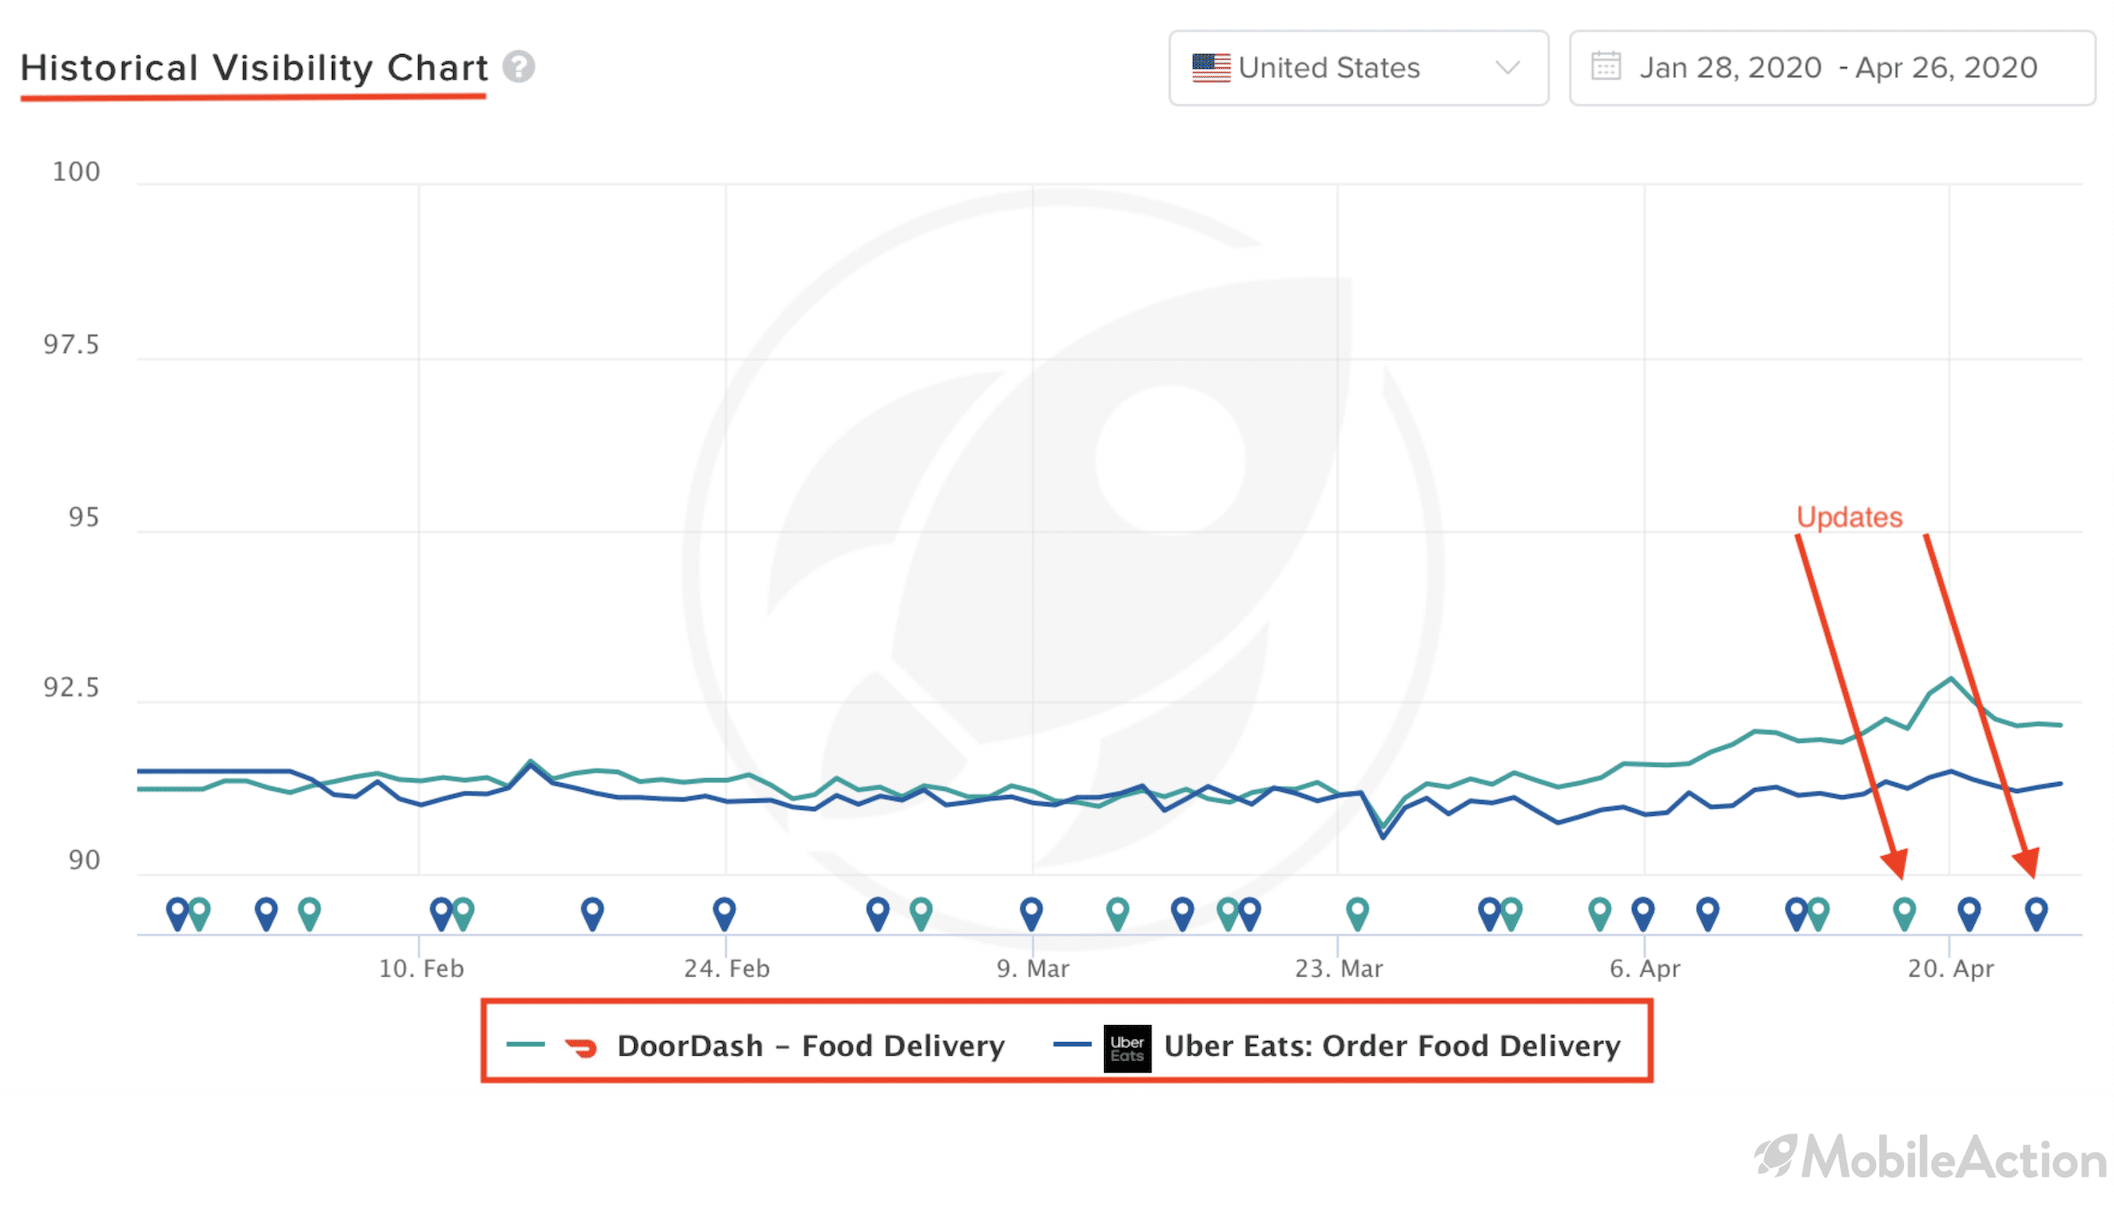
Let’s look at their Historical Visibility Chart. We can see that for both of the apps there have been multiple updates. And we see that these updates have affected the visibility positively.
While at the beginning of 2020, both apps seemed to have close visibility scores to each other. Around 91 (visibility score) in the US (Uber Eats higher by a little), at the end of the first quarter. However, DoorDash is now way ahead of Uber Eats. To get deeper and more detailed analysis on this, we can click on the little update pins and find out what kind of updates have been made for given dates. And we can evaluate this change accordingly with the change of visibility.
Daily Country Visibility Score
Of course one of the most important steps for good visibility is localization. They go hand in hand. These two apps are clearly known worldwide and so it seems they value localization. Wouldn’t it be great to confirm this with figures?
Let’s look at the visibility scores from a localization perspective.
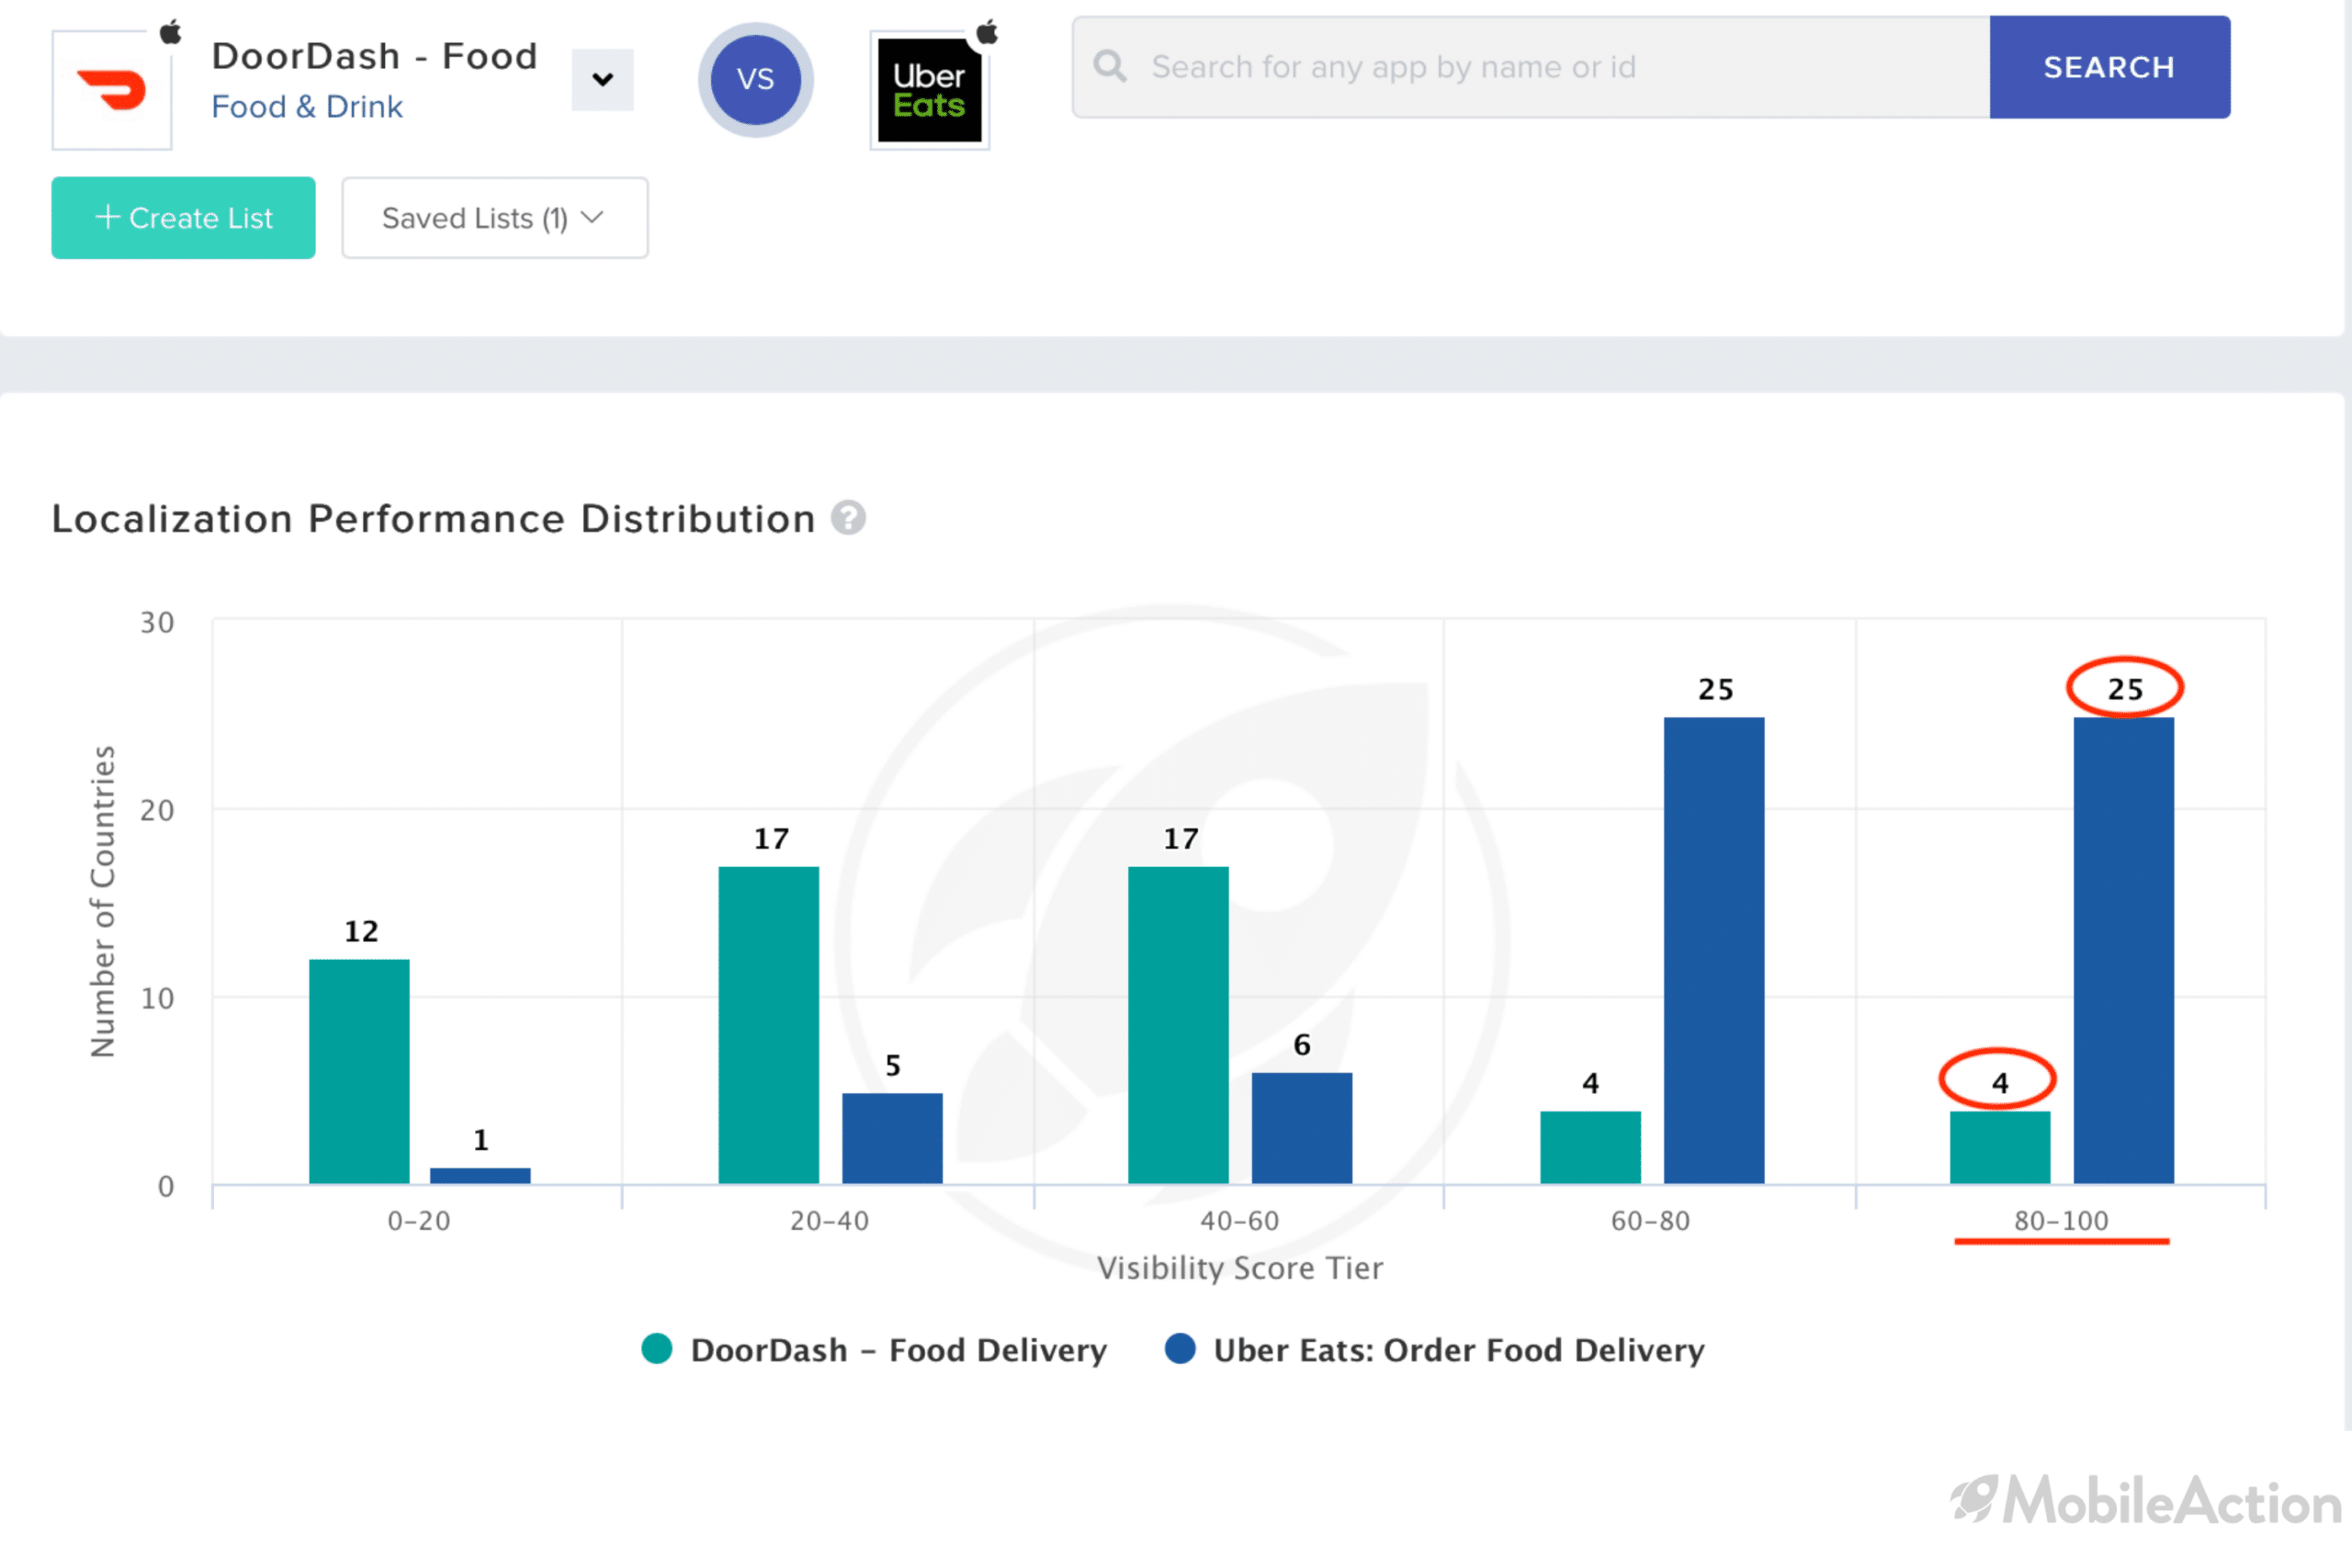
As seen in the graph above, Uber Eats has broader visibility. Uber Eats has more than 80% visibility score in 25 countries. Its also ahead when we look at the 60-80% range.
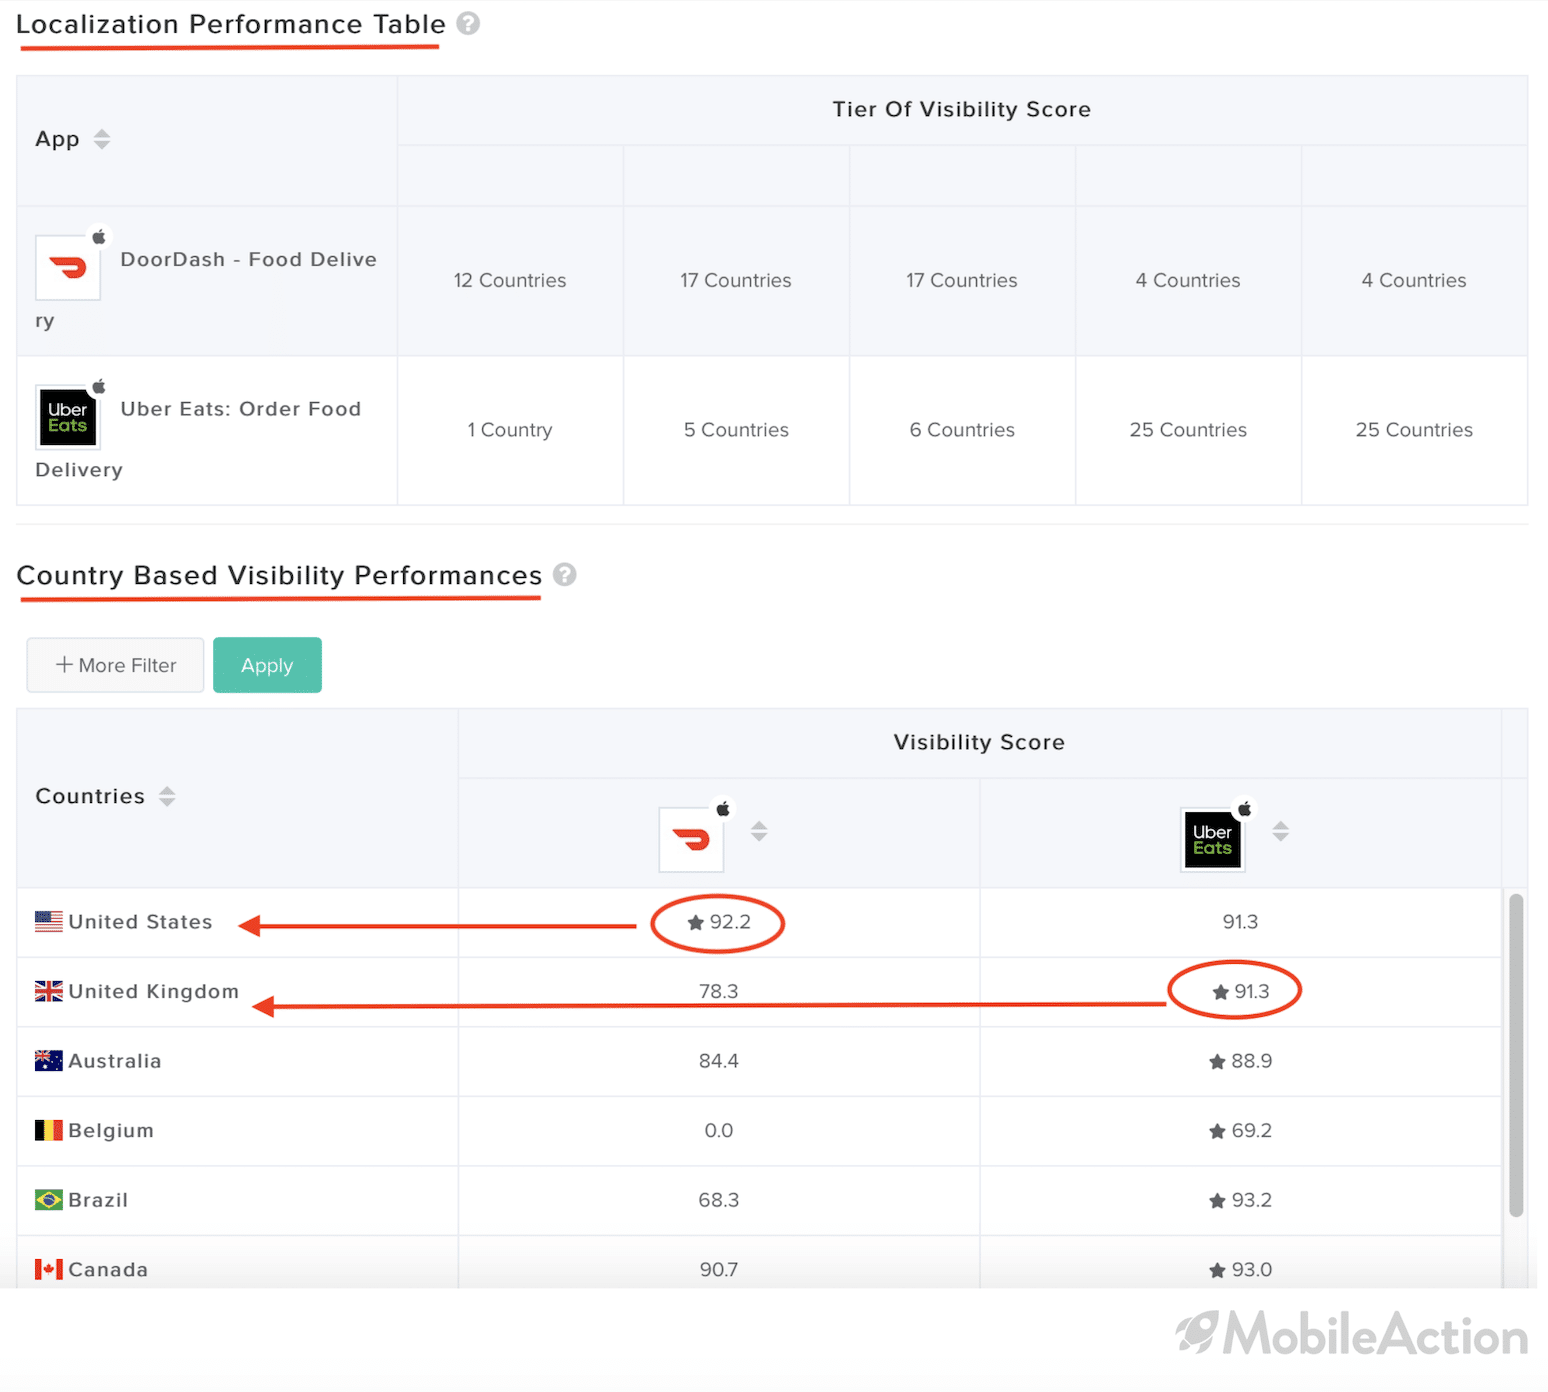
If we scroll down a bit, we can see Country Based Visibility Performances.
This is a detailed table that shows your app’s and its competitors’ visibility scores for each country. With it, you can quickly spot the winner app for every country and filter countries accordingly to visibility scores. Additionally, checking the “Localization” page for the countries that your competitor has an advantage in terms of visibility, would also be a good idea.
DoorDash seems to have fallen behind with visibility in the majority of countries. However, in the US, it suppresses Uber Eats.
One thing that makes this table so easy to use is the little star signs “*” next to the highest visibility scores. You can easily spot the winner app for each country that way. We can also do sorting with the up and down arrows (next to the apps). And see in which countries they’ve been increasing/decreasing. The above screenshot is sorted to show DoorDash’s highest visibilities.
If you’re not visible, it doesn’t matter how good your app is. If you’re less visible than your competitor, you can’t get the bigger piece from the cake.
MobileAction provides a brave new tool “Visibility Report” for your ASO Intelligence analysis. With this new tool, you’re not only available to analyze your own performance in visibility area and localization, but also your competitors and your apps similar to you.
Uber Eats and DashDoor both have managed to be one of the leading apps on food&drink category by applying the proper strategies.
To join our crew of 300k winning users and for many more actionable insights, sign up for MobileAction!