Products
Newsletter

Subscribe to never miss an update in mobile app marketing.

Login
Get Started
Book a Demo

Understand your app's performance with app store analytics

Connect visibility, conversion, and revenue with data from Apple Ads, the App Store, and Google Play Store, and turn app store insights into your next action.

Trusted by 5,000+ mobile app and game companies around the world

spotify logo starbucks logo crypto.com logo square logo grammarly logo calm logo priceline logo paramount logo zalando logo dream logo productmadness logo fox logo wolt logo creditcarma logo
 Get the full app analytics picture in one view
Analytics Overview
Get the full app analytics picture in one view
  • Unified performance dashboard
    See all your key metrics, downloads, rankings, and revenue, in one view.
  • Cross-store visibility data
    Compare organic and paid results side by side to understand how visibility turns into installs and revenue.
  • App performance history
    Visualize your app’s key metrics over time to understand progress, seasonality, and growth shifts.
Start Now
See how installs split between paid and organic
Download Report
See how installs split between paid and organic
  • Source-level install breakdown
    See where your installs come from by source type to identify your strongest acquisition source.
  • Country-based performance trends
    Track how downloads evolve across different regions and timeframes to spot high-growth opportunities.
  • Comparison across time frames
    Monitor install trends over custom time ranges to understand how marketing efforts and seasonal shifts impact growth.
Start Now
Measure your app’s financial performance
Revenue Snapshot
Measure your app’s financial performance
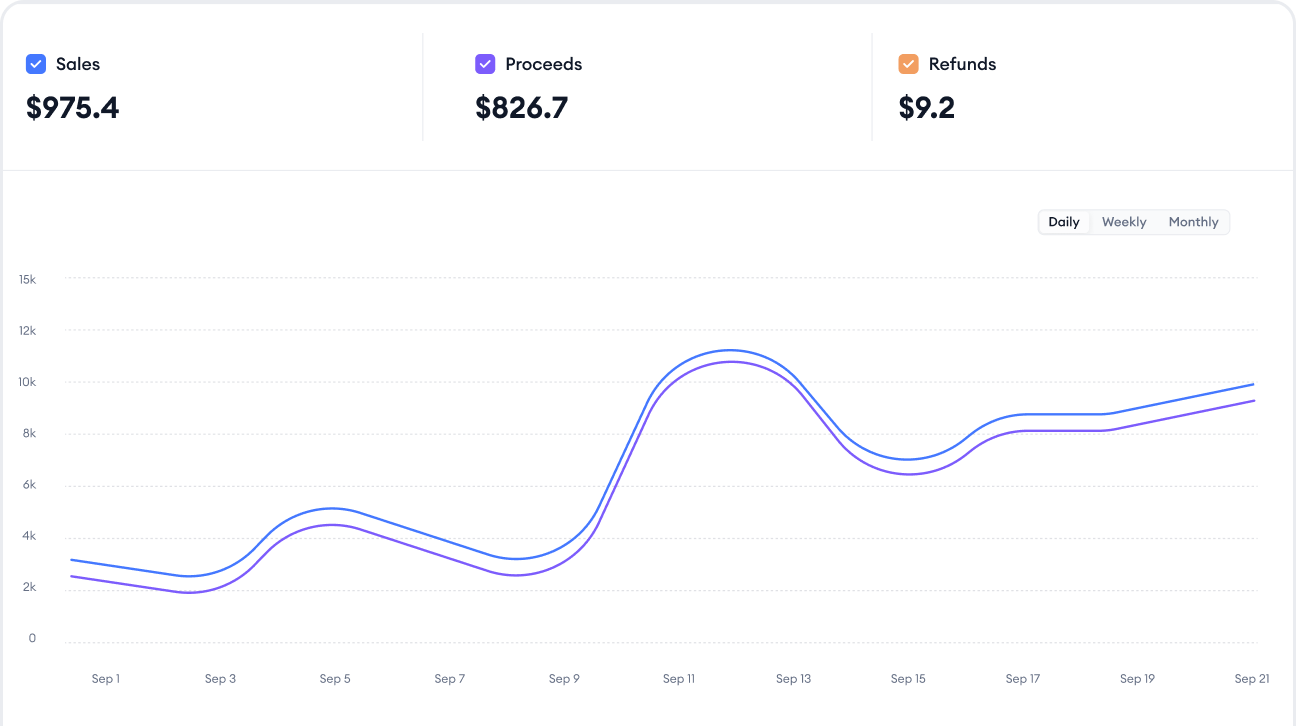
  • Sales, proceeds and revenue tracking
    Monitor total sales, proceeds and refunds across App Store and Google Play Store to evaluate performance accurately.
  • Country-level performance view
    Break down revenue by country to find your strongest markets and guide your budget or localization decisions.
  • Table and chart views
    Check visual charts and detailed tables for daily, weekly and monthly data to analyze revenue patterns and prepare reports.
Start Now
Find out how organic performance fuels installs
Organic Acquisition Dashboard
Find out how organic performance fuels installs
  • AI-based download trend analysis
    Detect visibility shifts early with AI-based trend detection that highlights emerging opportunities and performance changes automatically.
  • Keyword & ranking performance
    Track the monthly count of ranked keywords, see how your app’s average ranking has changed over time, and explore keyword distribution across ranking tiers and movement trends.
  • Review and source analysis
    Get summarized review trends and download source breakdowns to connect user sentiment and acquisition patterns with organic growth.
Start Now
Track your app store conversion rate from impression to install
Conversion Funnel View
Track your app store conversion rate from impression to install
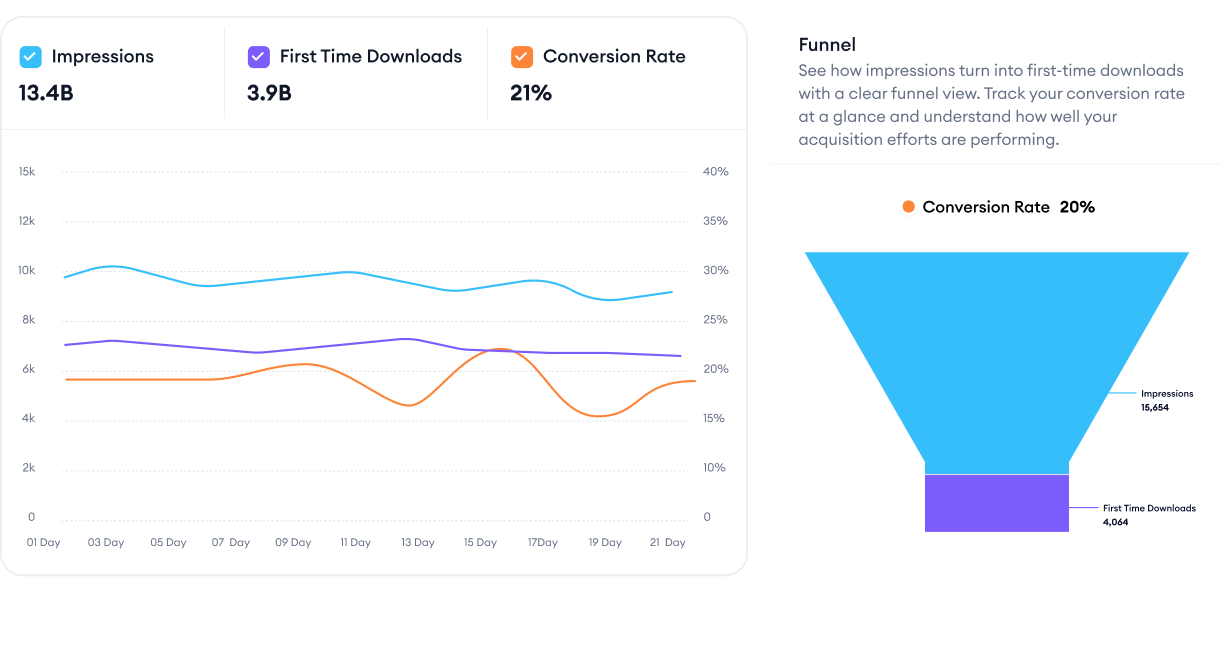
  • Funnel performance tracking
    Monitor how impressions and first-time downloads connect in a clear graph view to understand conversion flow.
  • 6-month trend visualization
    Review month-by-month bar charts of your key metrics, pulled from App Store Connect analytics and Google Play data.
  • Conversion impact analysis
    Track conversion rate changes at a glance to measure how your store visibility turn into installs.
Start Now

Frequently asked questions

What is app store analytics?
It’s the measurement layer for your store presence. It brings downloads, rankings, revenue, and conversion together across Apple Ads, the App Store, and Google Play Store, so a change in any one of them shows up next to the others instead of in a separate tool. That's what makes it answer the questions that actually matter: what changed, when it changed, and what likely caused it, whether that was a metadata update, a campaign shift, or the season doing its work.
How do I know whether my installs came from paid or organic?
The install split does it for you. Every download traces to a source type, so a spike separates into what your spend bought and what visibility brought for free. That split is the difference between scaling a win and repeating an accident.
What is an app store conversion rate?
The share of people who see your store page and install. Watching it alongside impressions shows whether a downloads change came from more visibility or better convincing, which decides whether your next move is keywords or creatives.

Hear from our customers

“MobileAction’s API provided the accurate and comprehensive ASO data we needed to power our AI-driven ASO model. It helped us automate competitor analysis, refine creative localization, and improve operations across regions. The API has become a vital part of our global growth strategy.”
Jin Liang
Jin Liang
ASO Product Manager @AliExpress
Read the Full Success Story
“We recommend MobileAction CMP, especially for teams managing multiple Apple Ads accounts, large budgets, or struggling with keyword expansion and automation. The platform has improved our bidding efficiency, reduced trial-and-error costs, and helped us unlock scalable growth. MobileAction is an essential partner in our Apple Ads strategy.”
“MobileAction has become a source of truth for our paid and organic data. The dashboards, alerts, and flexible reporting give us everything we need to move quickly and confidently. It’s like having an extra member on our app growth team.”
Marcin Kobylec
Marcin Kobylec
Head of App and Marketing Automation
Read the Full Success Story
“If you are looking for a tool to understand post-install performance for your app better, MobileAction CMP is the answer. It has been a game-changer in how we optimize our Apple Ads campaigns.”
Nicholas Rusch
Nicholas Rusch
Paid Marketing Manager
Read the Full Success Story