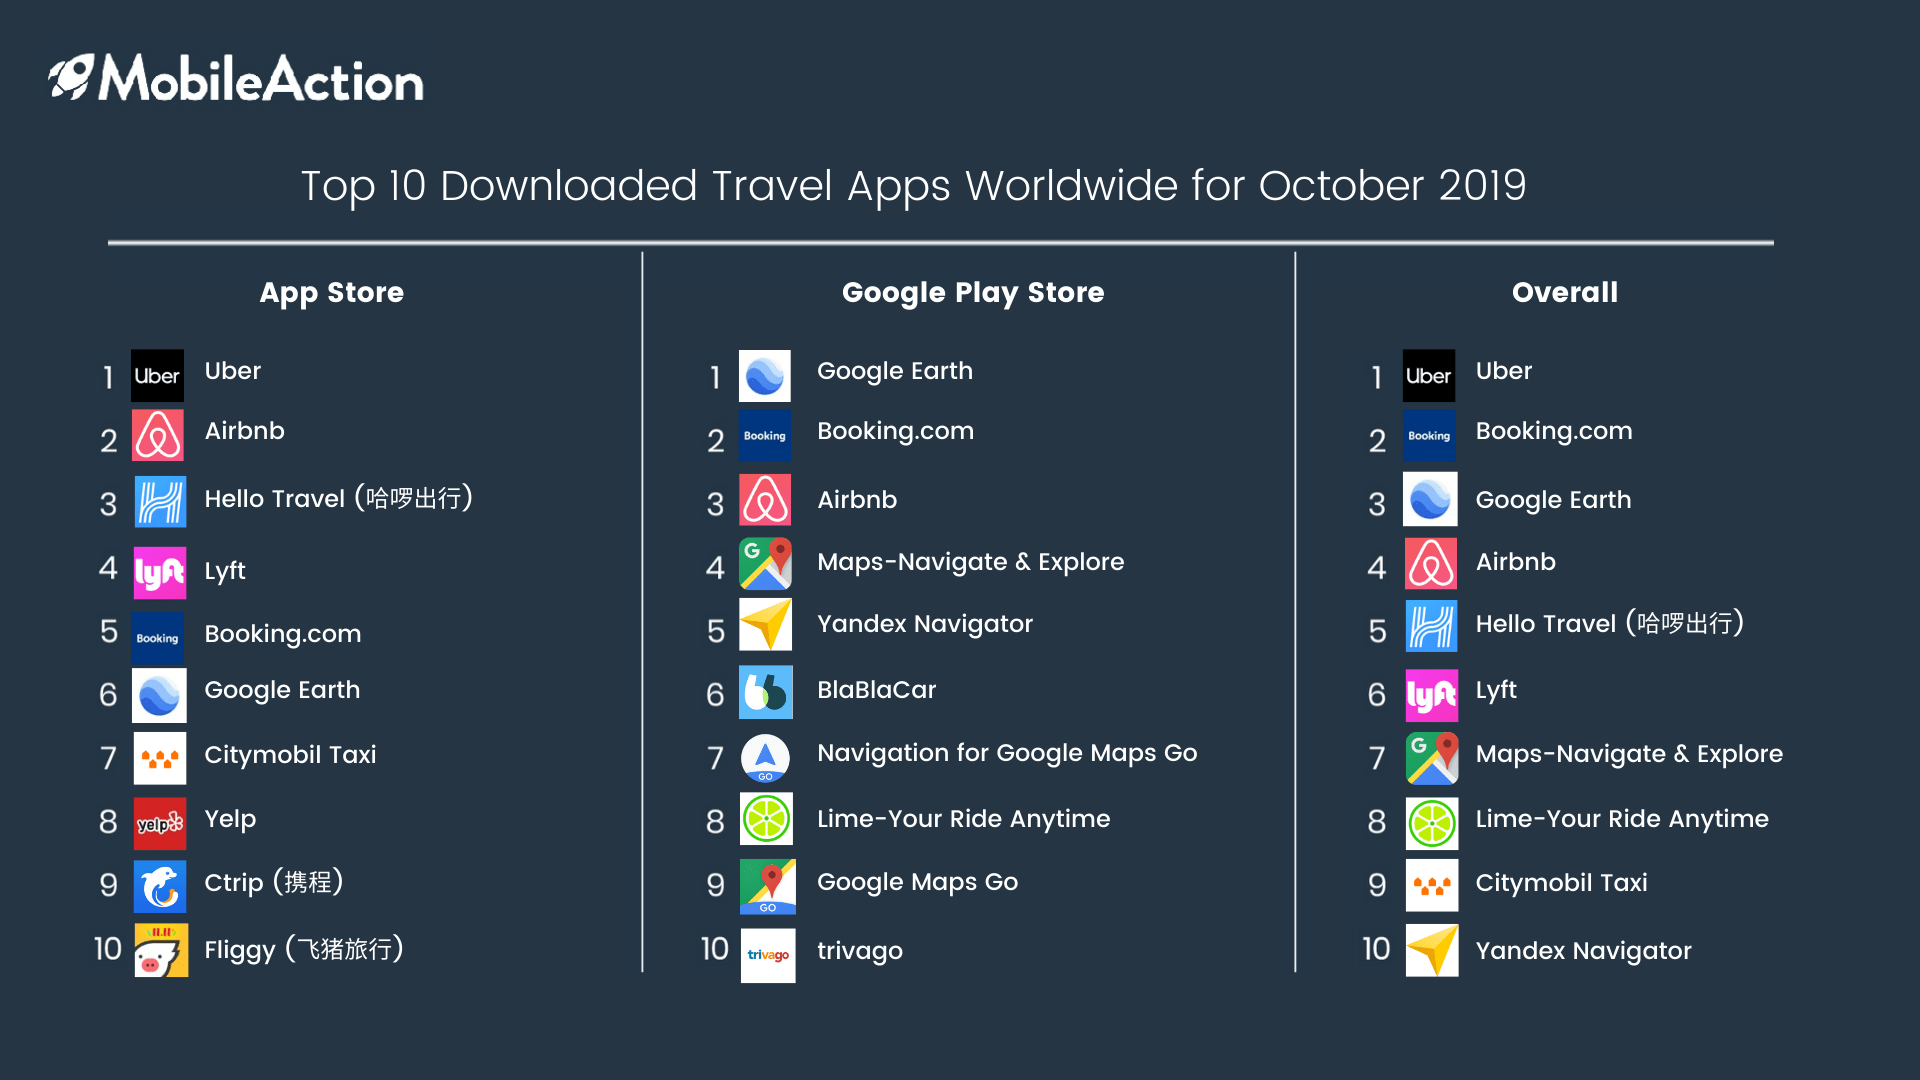
The above chart shows the top downloaded travel apps worldwide in October 2019. Uber was the most downloaded app in the App Store with approximately 4.3 million downloads in October 2019. In the Play Store, Google Earth took the lead with more than 2 million downloads. Following up, Airbnb and Booking.com took second place in the App Store and Google Play Store respectively.
Uber, again, got the first place in the combined download estimations from both stores, and Booking.com followed it closely. While navigation and map apps were the most downloaded ones in the Play Store, the apps useful for sharing rides, booking hotels, and finding travel recommendations seem to be more popular in the App Store for the travel category. The reason for that distinction can be attributed to the category differences between these two stores. For instance, Uber is in the “Travel” category in the App Store, but in the “Maps and Navigation” category in the Google Play Store.
To get more insights, we can take a look at the Audience Geography for two similar apps to understand the geographical distribution of the users.
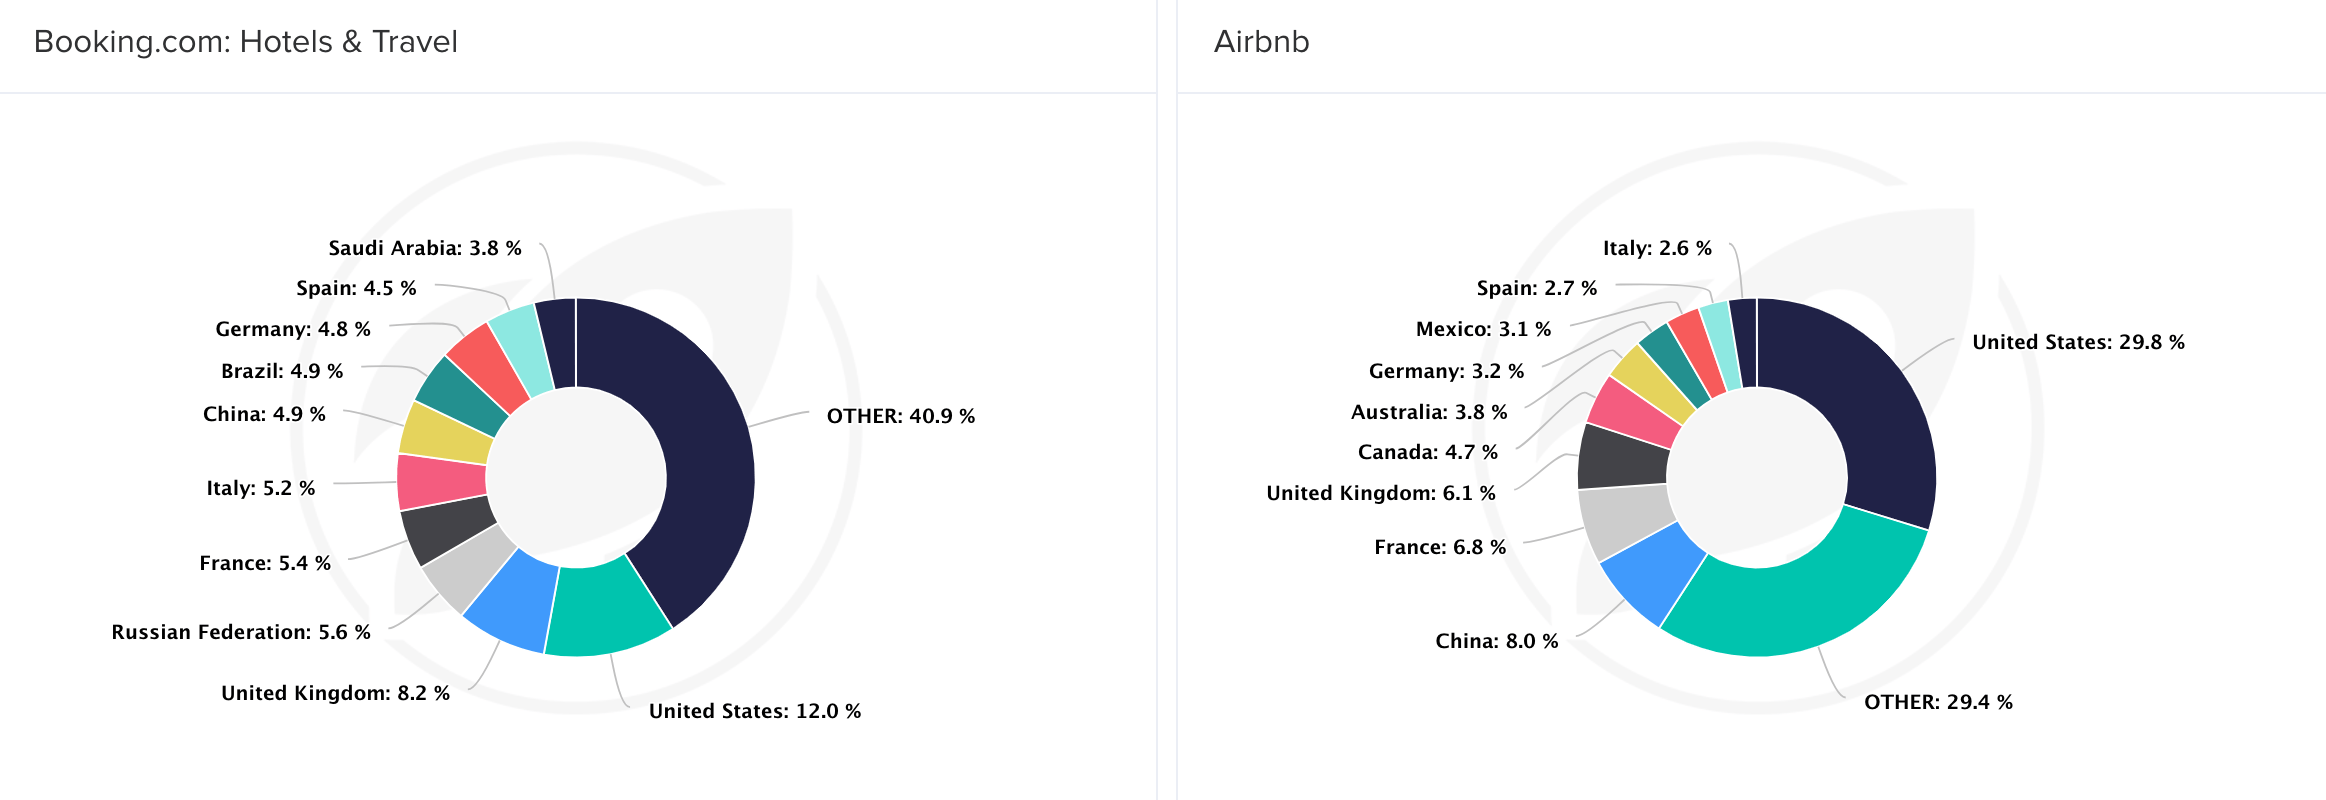
As you can see above, Booking.com has a wider variety of audiences in terms of nationalities while the majority of the users of Airbnb seem to be from the U.S. This difference may stem from the overall business strategy of these two apps, number of countries they operate in, their ad and user acquisition strategies, and the effectiveness of their app localization strategies.
Ad strategies of these two apps can also give some clues about their success. Below, you see the Campaign Analysis dashboards of Booking.com and Airbnb for all countries from our Ad Intelligence product:
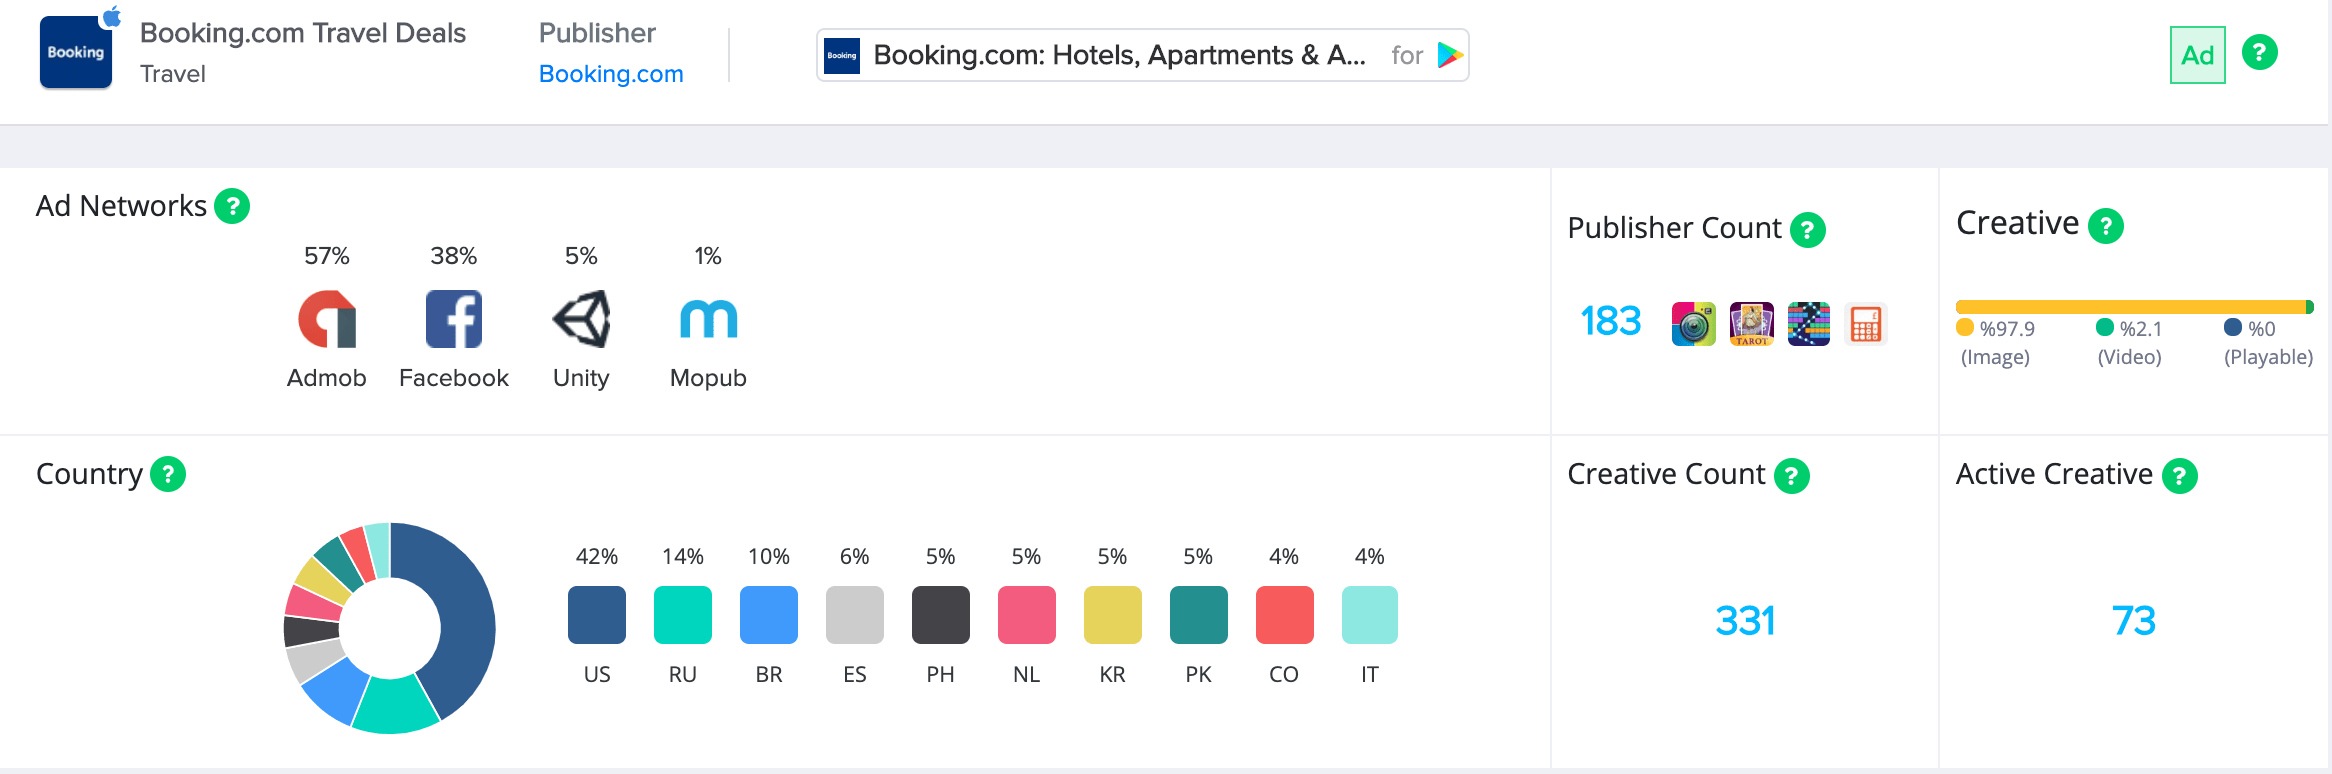
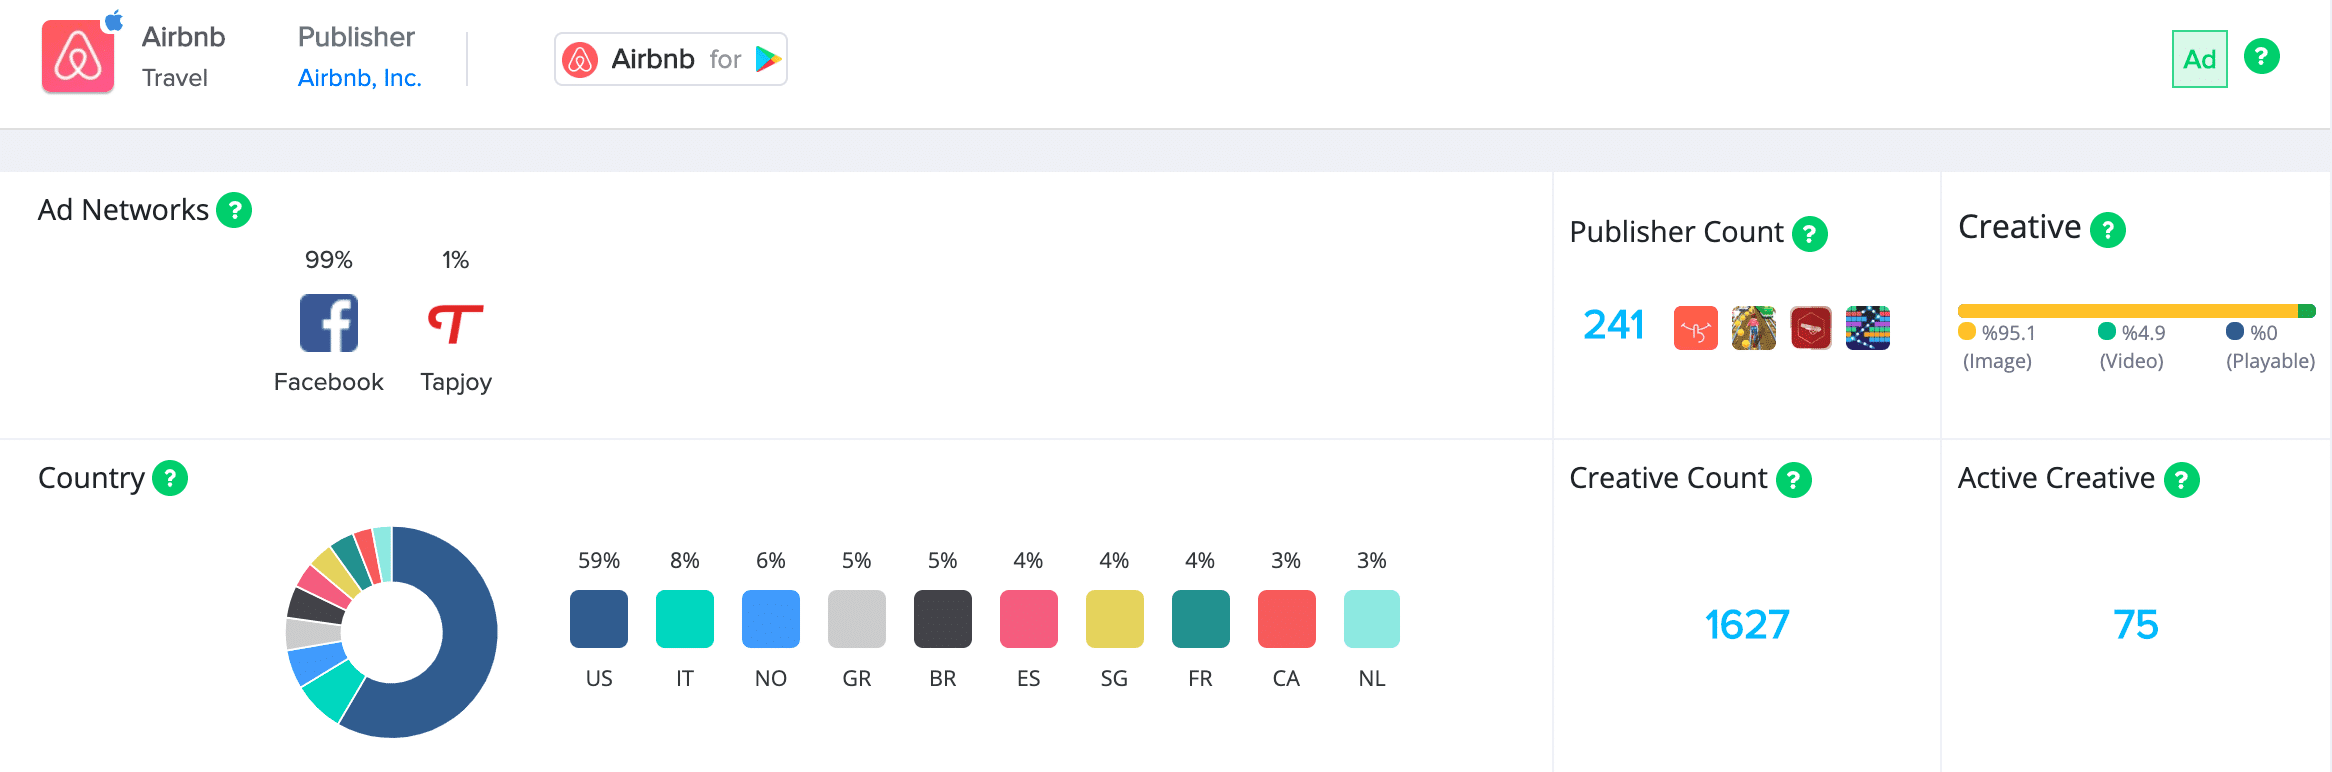
Booking.com has more diversity in terms of ad networks while Airbnb mainly sticks with Facebook. Ad activities of both apps are mainly active in the U.S. The publisher counts and the distribution of type of creatives look quite similar. Yet, notice that Airbnb has almost 5 times more creatives than Booking.com has, and this explains the higher impression shares of Airbnb.
If you’re curious about how we do ad strategy analysis, you can read the case study of Mr Bullet game of Lion Studios here.
The download data is sourced from our Market Intelligence product. In addition to download data, our users are able to see Revenue estimations, Daily Active Users (DAU), Monthly Active Users (MAU), and Audience Geography. We offer this data as a dashboard in our Market Intelligence Plan.
Interested in learning more or the data we can offer? Schedule a demo with us!