
What are the creative trends for casual games? Amongst all games, casual games might be the easiest to love and get addicted to because of the simpler game-play and narratives they offer. They target a wider audience. Anyone from a bored kid to an adult on their way to work can play them. Just kidding, please don’t game and drive 🙂
But there are hundreds of thousands of casual games on the app market. Everything from puzzle to role play to even some action games can fall under the casual game category. Naturally, becoming a brand name in this category is a challenging task like no other.
Unless you’ve been living under a rock for the past couple of years, you’ve surely heard of Candy Crush Saga, Project Makeover, or Homescapes. You probably even know their publishers. Surely they didn’t become a-class games overnight but have applied certain marketing and ad strategies to reach success.
And what is most important with marketing an app?
Their creatives.
Creatives are arguably what makes or breaks your app. It’s the decision-maker for users.
The success of big names doesn’t have to be a mystery, it takes a quick creative analysis, and you can already get a clue about what they’re doing right and implement your own UA strategies. In this detailed ad analysis report, we will be comparing Playrix, King, MoonActive, Magic Tavern, Inc, MeetJoy Studios data for both Android and iOS to see what approaches they’ve applied.
If you are a UA manager this report will be helpful for you in planning future campaigns. We will be showing the creative trends using Top Game Advertisers we have mentioned above, so you can get an idea about what top competitors are doing and how they’re doing it.
The Publishers & Casual Games
Here’s a list of the publishers and their games in the casual category analyzed. While deciding which publishers and games to analyze, we didn’t just use the Top 10 App Publishers but we also considered which publishers had long-standing popular games. Some of these have not kept their place in the top 10 necessarily, but all of them have and continue to experience success. They all also make casual games.

The terms you need to know
Before we move on with the detailed analysis, here’s a small glossary of the terms we will be discussing in campaign analysis. If at any point something confuses you, you can just scroll back here.
Creative count: The total amount of creatives that have been used while running ads.
Active creative count: The number of creatives that are currently being used for active ads.
Creative types: Currently on our platform, we support the viewing of 8 media types. These are video, image, interstitial, banner, interactive, rewarded, end card, carousel.
Publisher count: The total number of apps that are currently publishing ads for the selected app.
Ad networks: The list of all the ad networks currently being used by the app to run their ads. On our platform, this is listed in order of most used to least used.
The data below is from Campaign Analysis from our Ad Intelligence tool. To get insights about any app in different categories schedule a demo with us.
We will be analyzing data for both the App Store and Google Play Store.
Creative Counts
When talking about creative trends, “Creative Counts” is quite obviously one of the most important parts of the analysis. We have made a deep analysis of Playrix’s Gardenscapes and their ad strategies in our previous blog.
The total amount of creatives that have been used by each of these apps while running in-app ads can be seen below.
Let’s first see how they’re doing on the App Store.
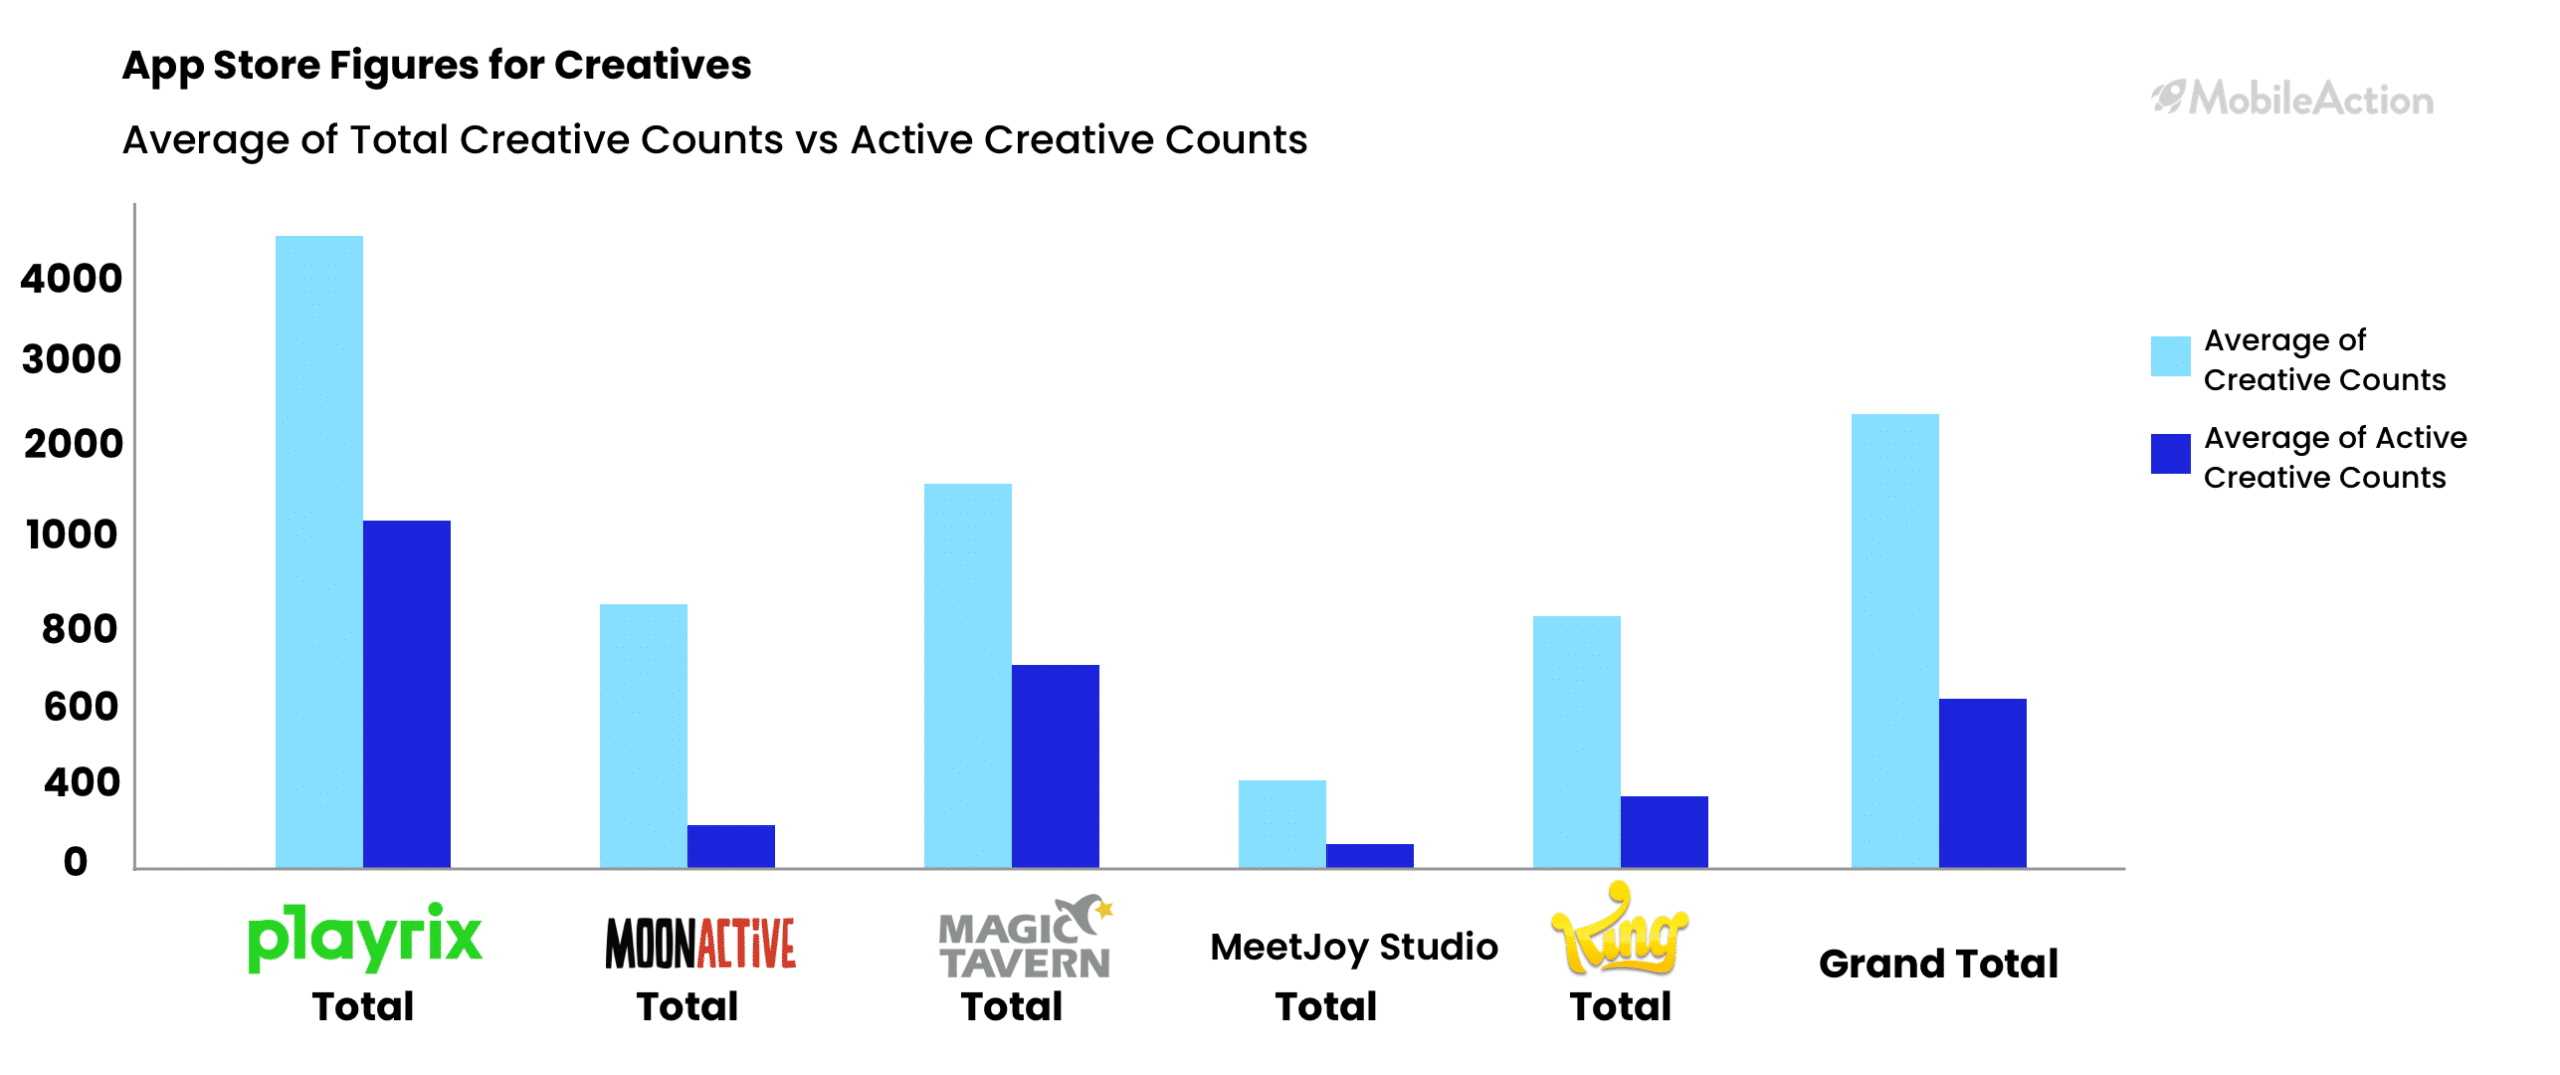
We can see on the graph that Playrix took first place on creative counts over on the App Store platform. It has more than one thousand creatives. However, the number of active creatives is around 600.
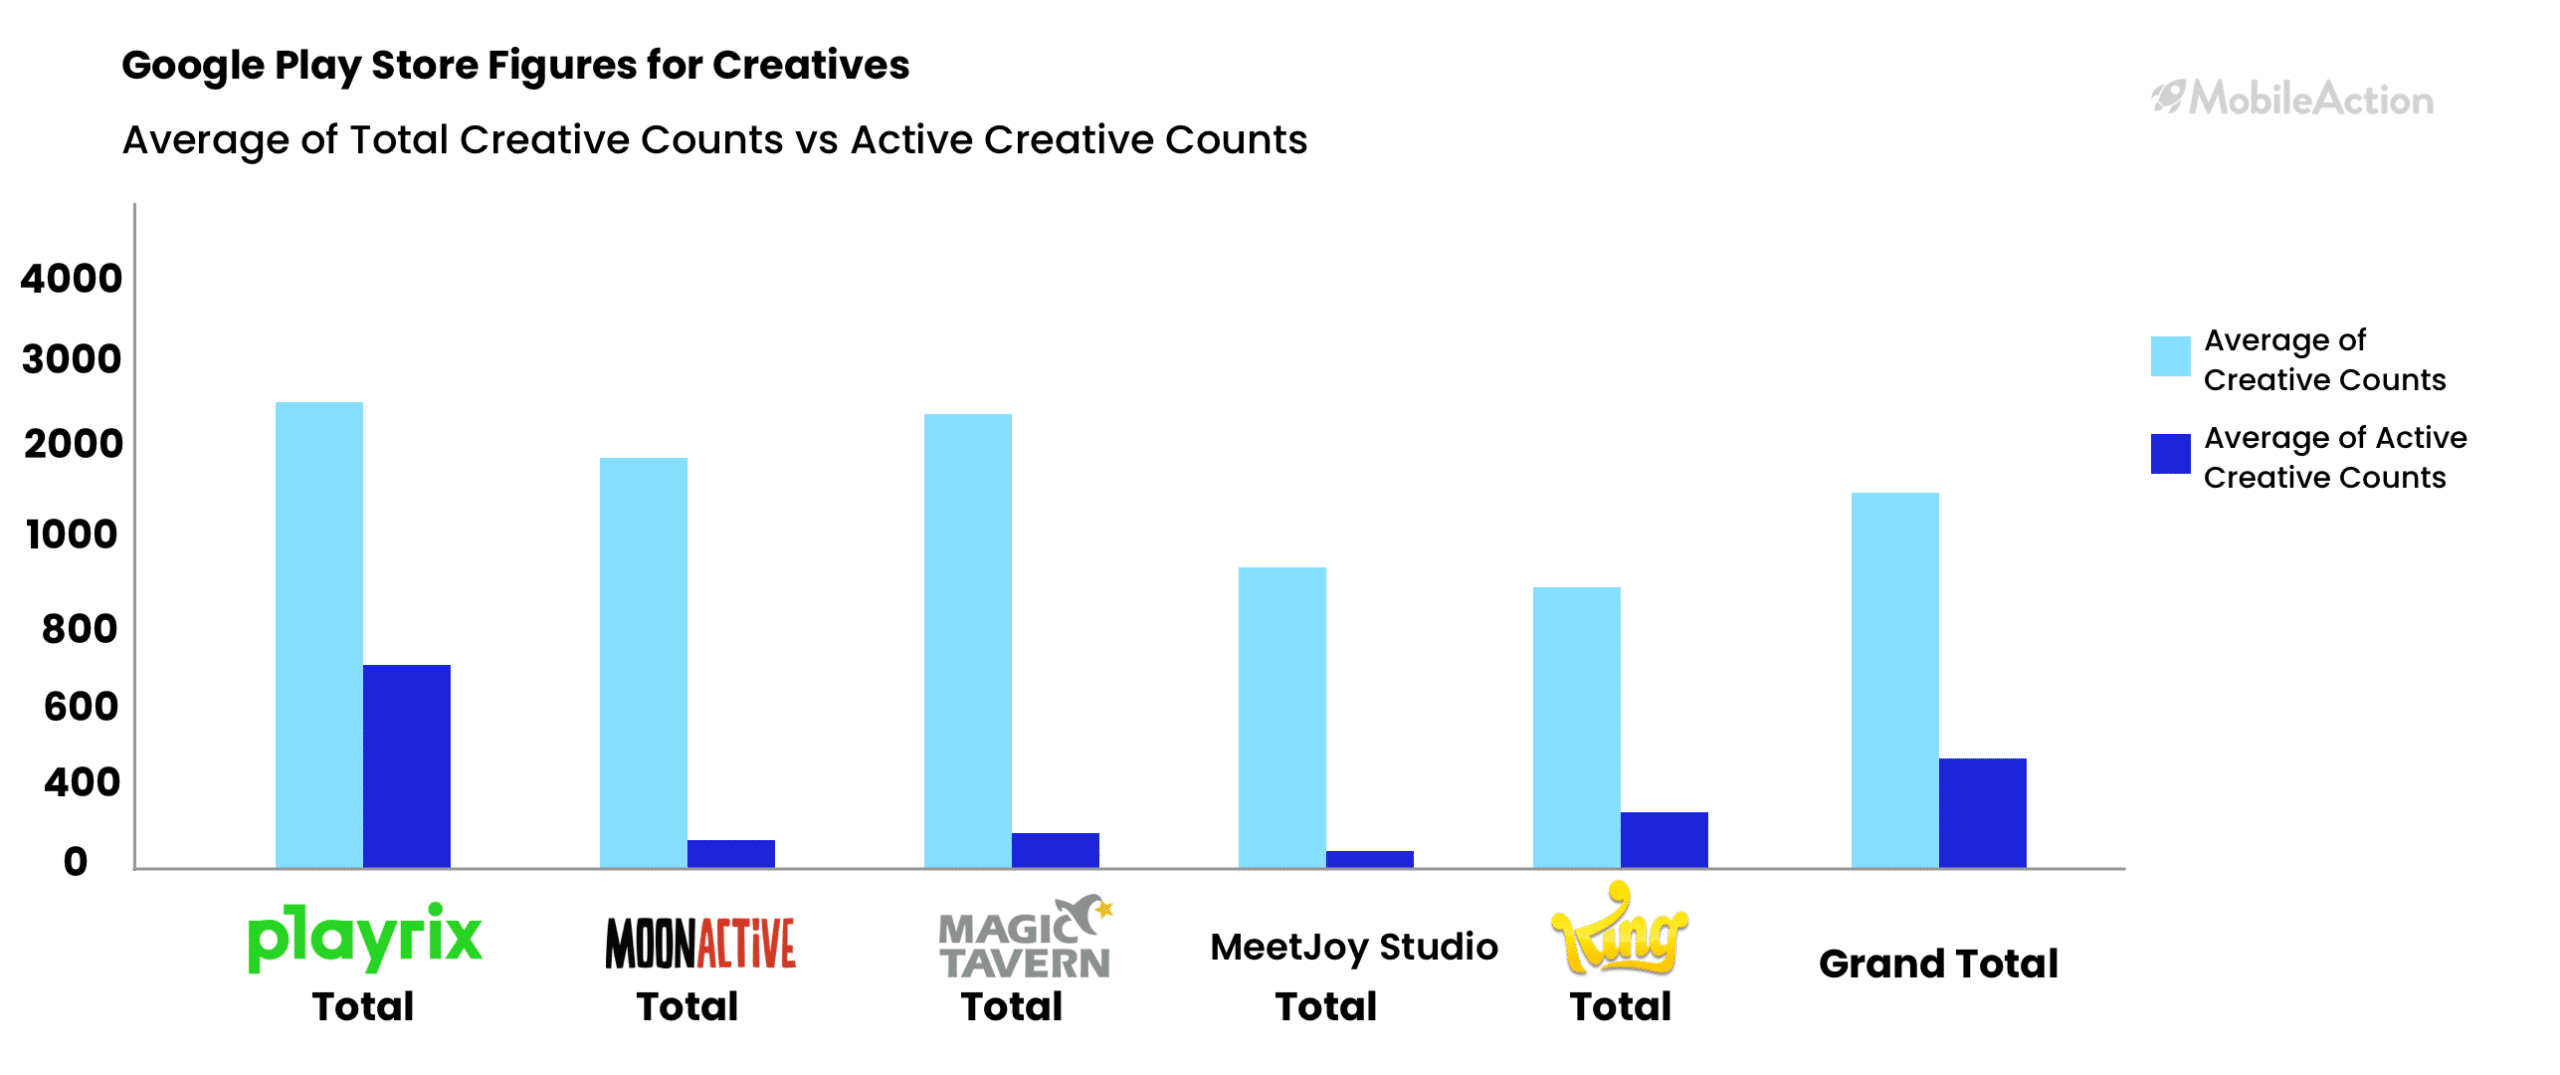
Let’s see how they’re doing on Google Play Store for comparison.

We can see on the graph that again Playrix is leading on creative counts on the Google Play Store platform. This time it has nearly one thousand creatives and the active creatives of Playrix are again around 600.
I’m not sure if you’ve noticed that or not. But for none of the publishers, the active creatives are as much as the total creatives. When we compare the averages of the active creatives counts, we can see that the averages on Google Play Store Creative Counts are higher than the App Store. This gives us a clue that publishers are keeping their creatives more aggressive over on Google Play Store.
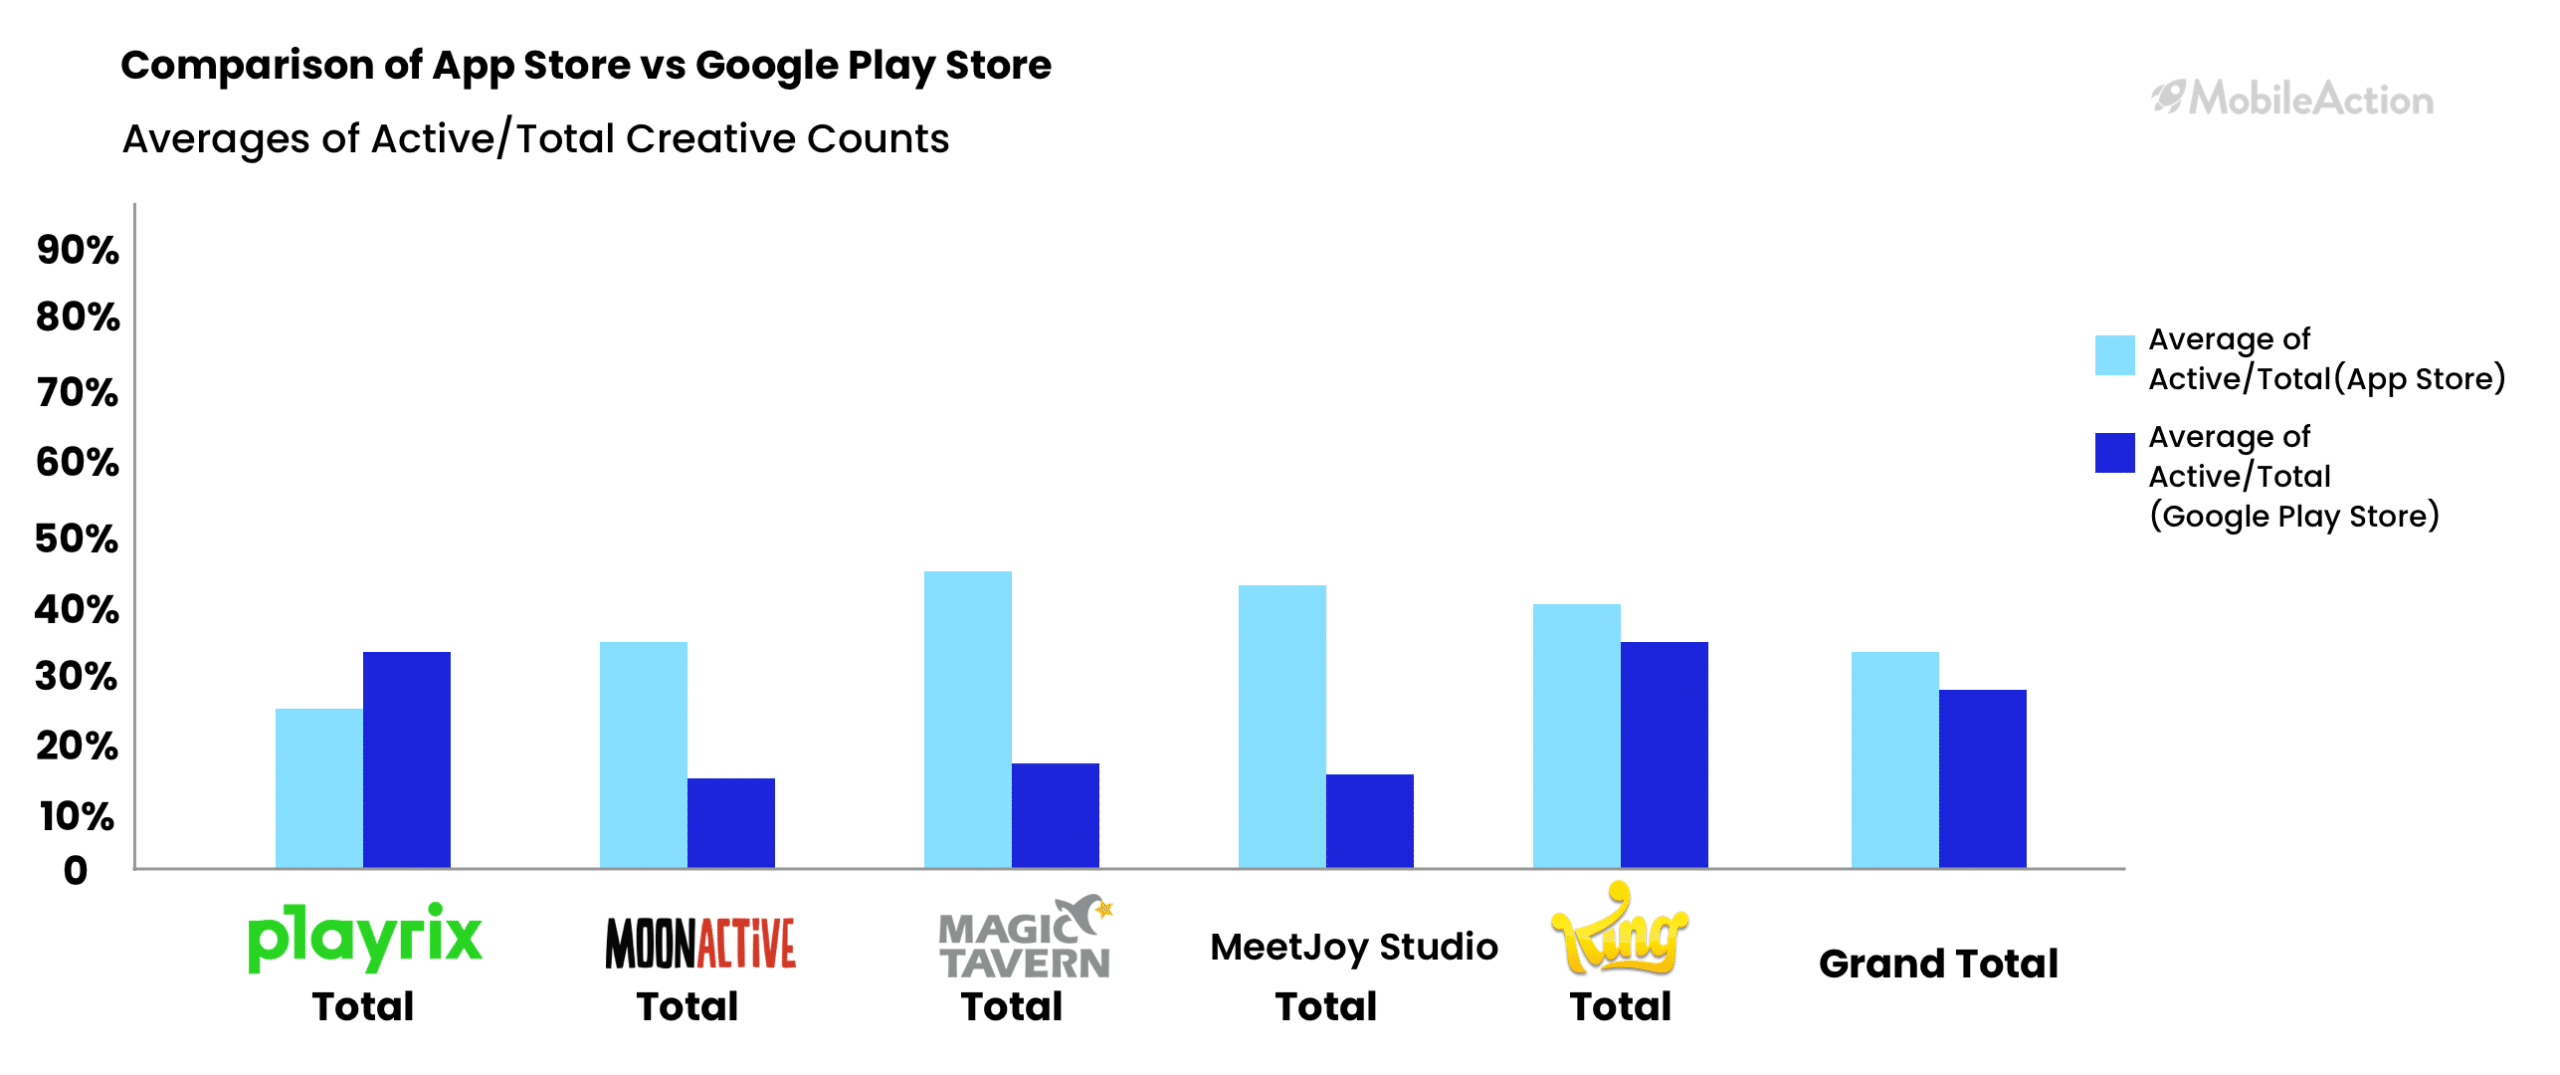
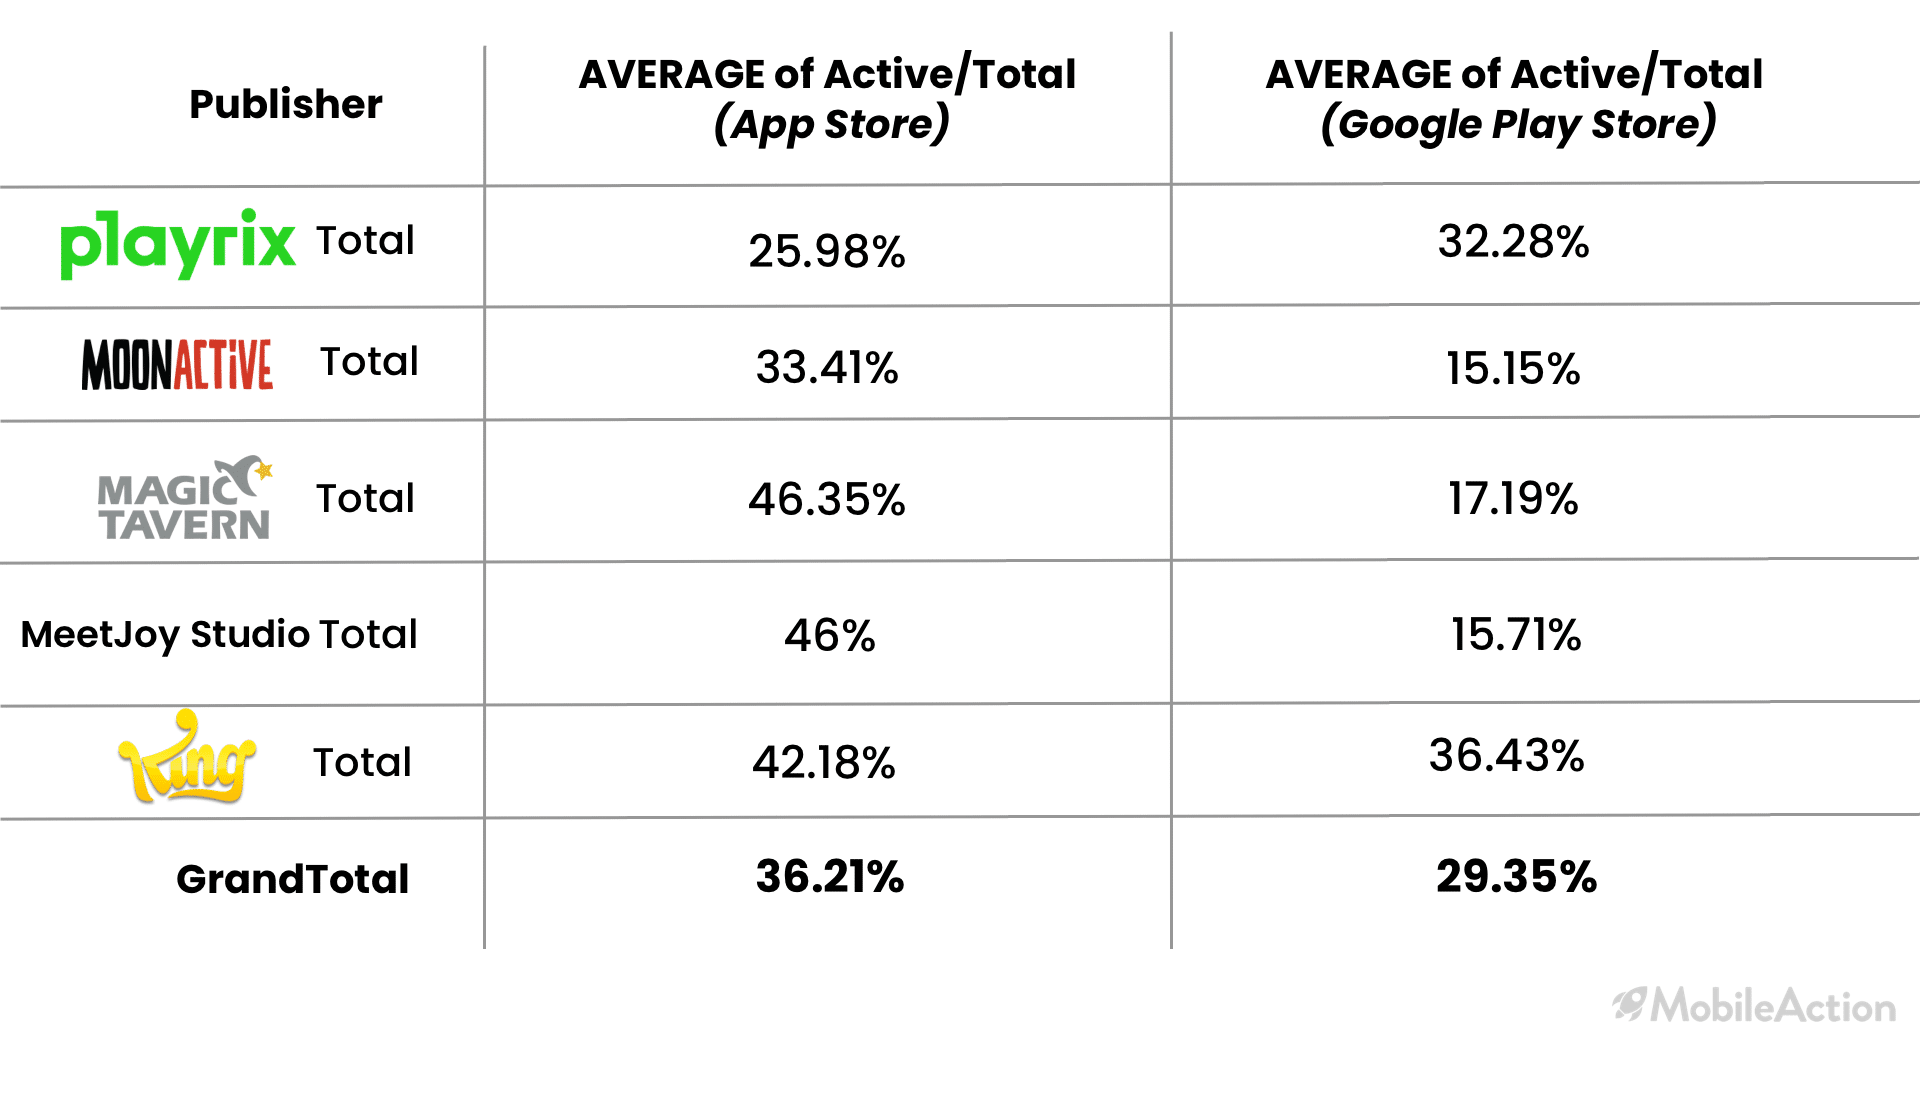
Another interesting point here is; even though a publisher can have the least number of creatives, its active creative to total creative percentage is higher than the others. And since their total to active creative ratio is high, we can come to the conclusion that they’re making use of their creatives more efficiently.
Creative Types
While thinking about creative types if we put ourselves in potential users’ shoes, we can understand why videos would be more attractive. This is especially true for games, as videos have the potential to showcase real gameplay. Playables are also very trendy in attracting new users.
As seen on the graph below; all of these three publishers prefer “Video” type for their apps on the App Store platform. Another thing we’ve noticed is that Playrix has more “Html” type ads. Most of the time, Html includes content that is composed of video, image, banner, end card image, and carousel images. The content type can be interstitial or rewarded.
App Store

We see that these three publishers prefer “Video” type ads for their apps on the Google Play Store platform.
Google Play Store
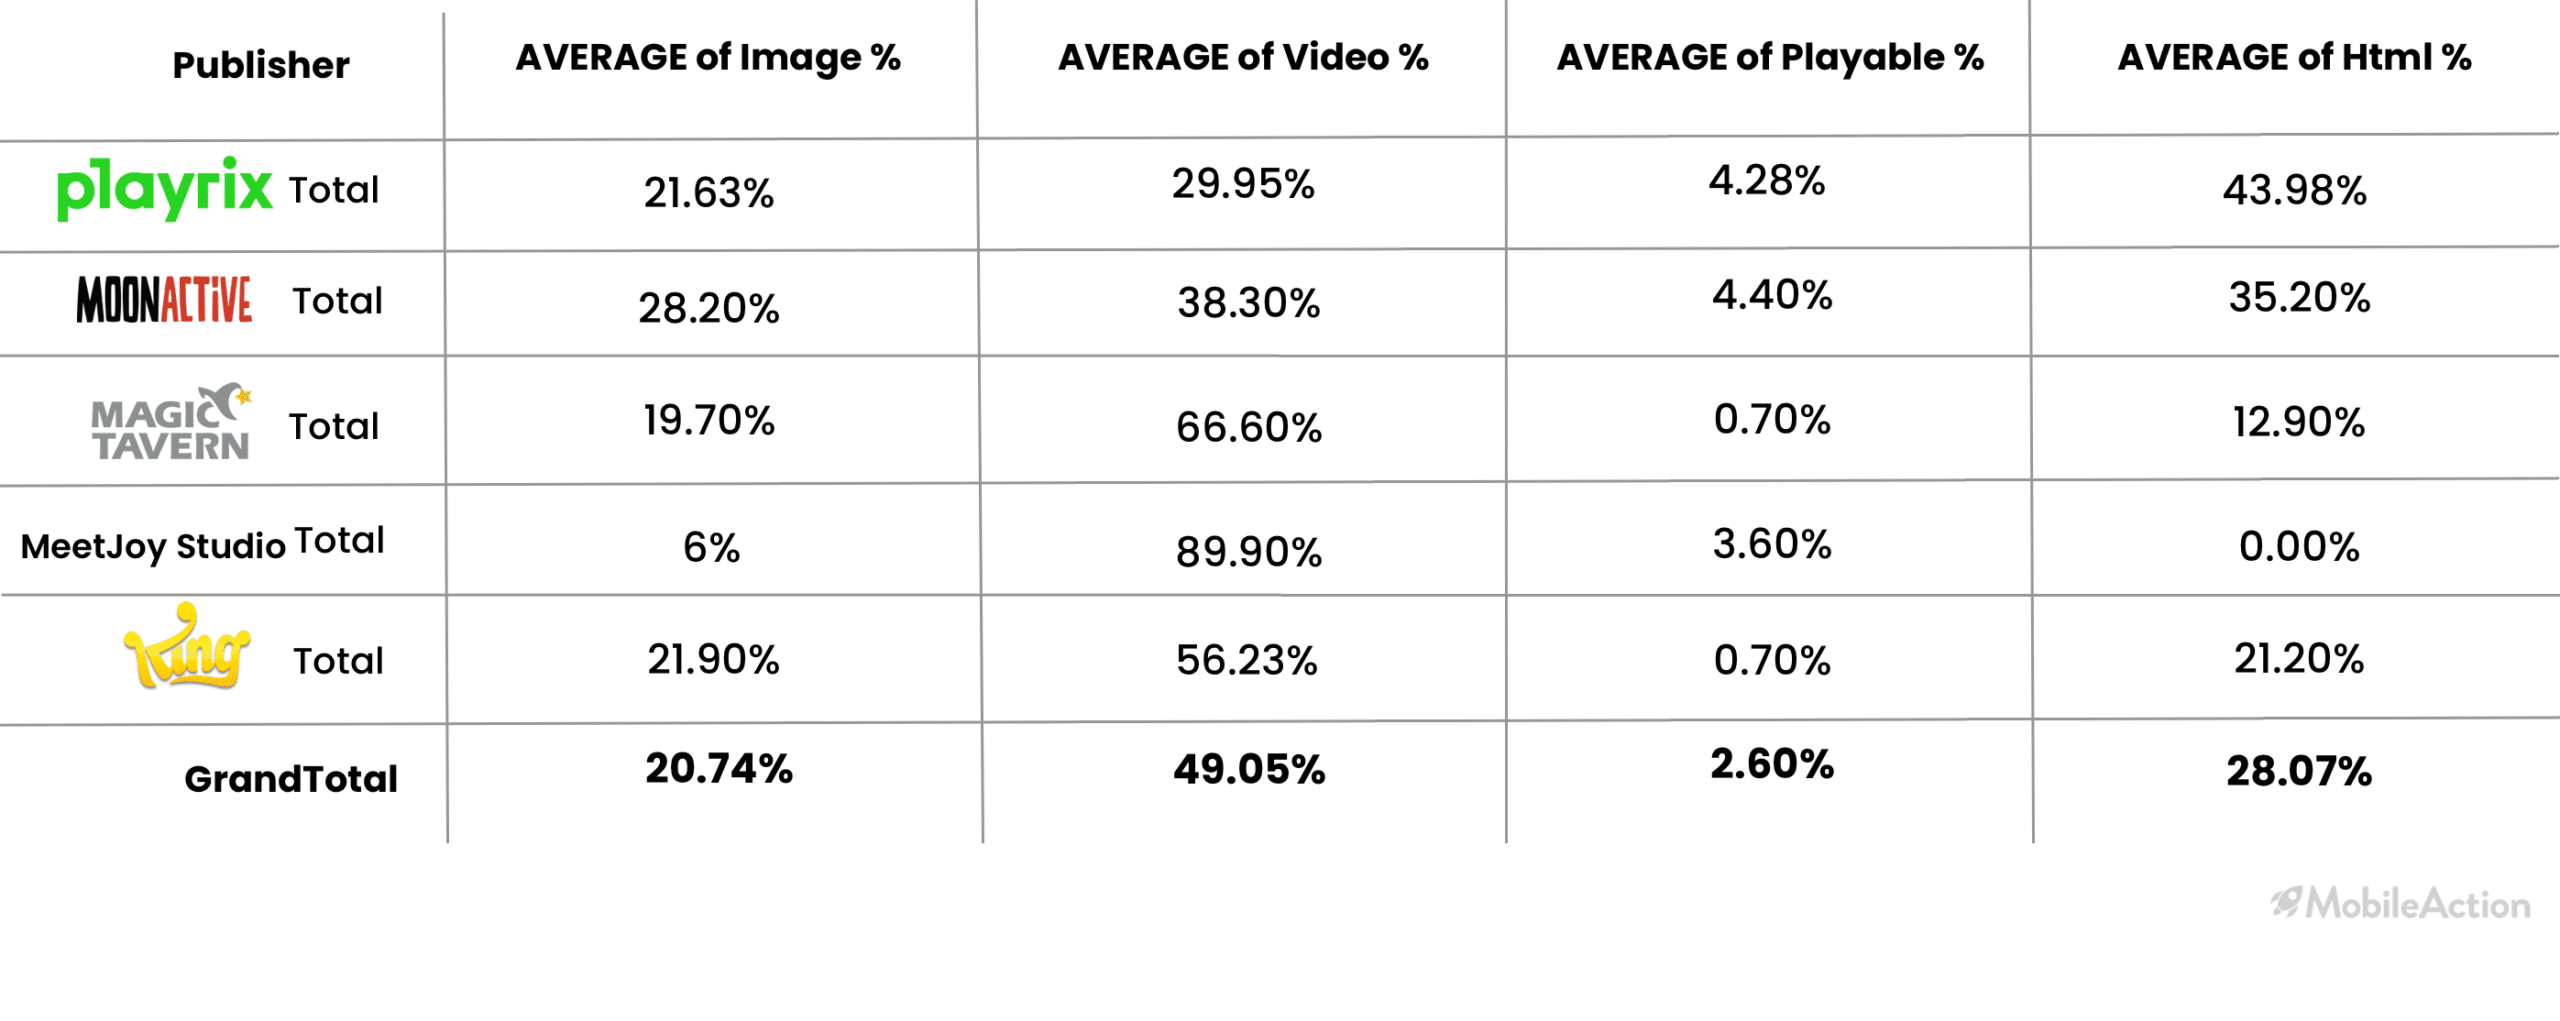
We see that again there’s a heavy usage of video creatives on Google Play Store but playable percentages are higher than App Store. Let’s have a look at the combined picture, how they use the ad types, as averages.
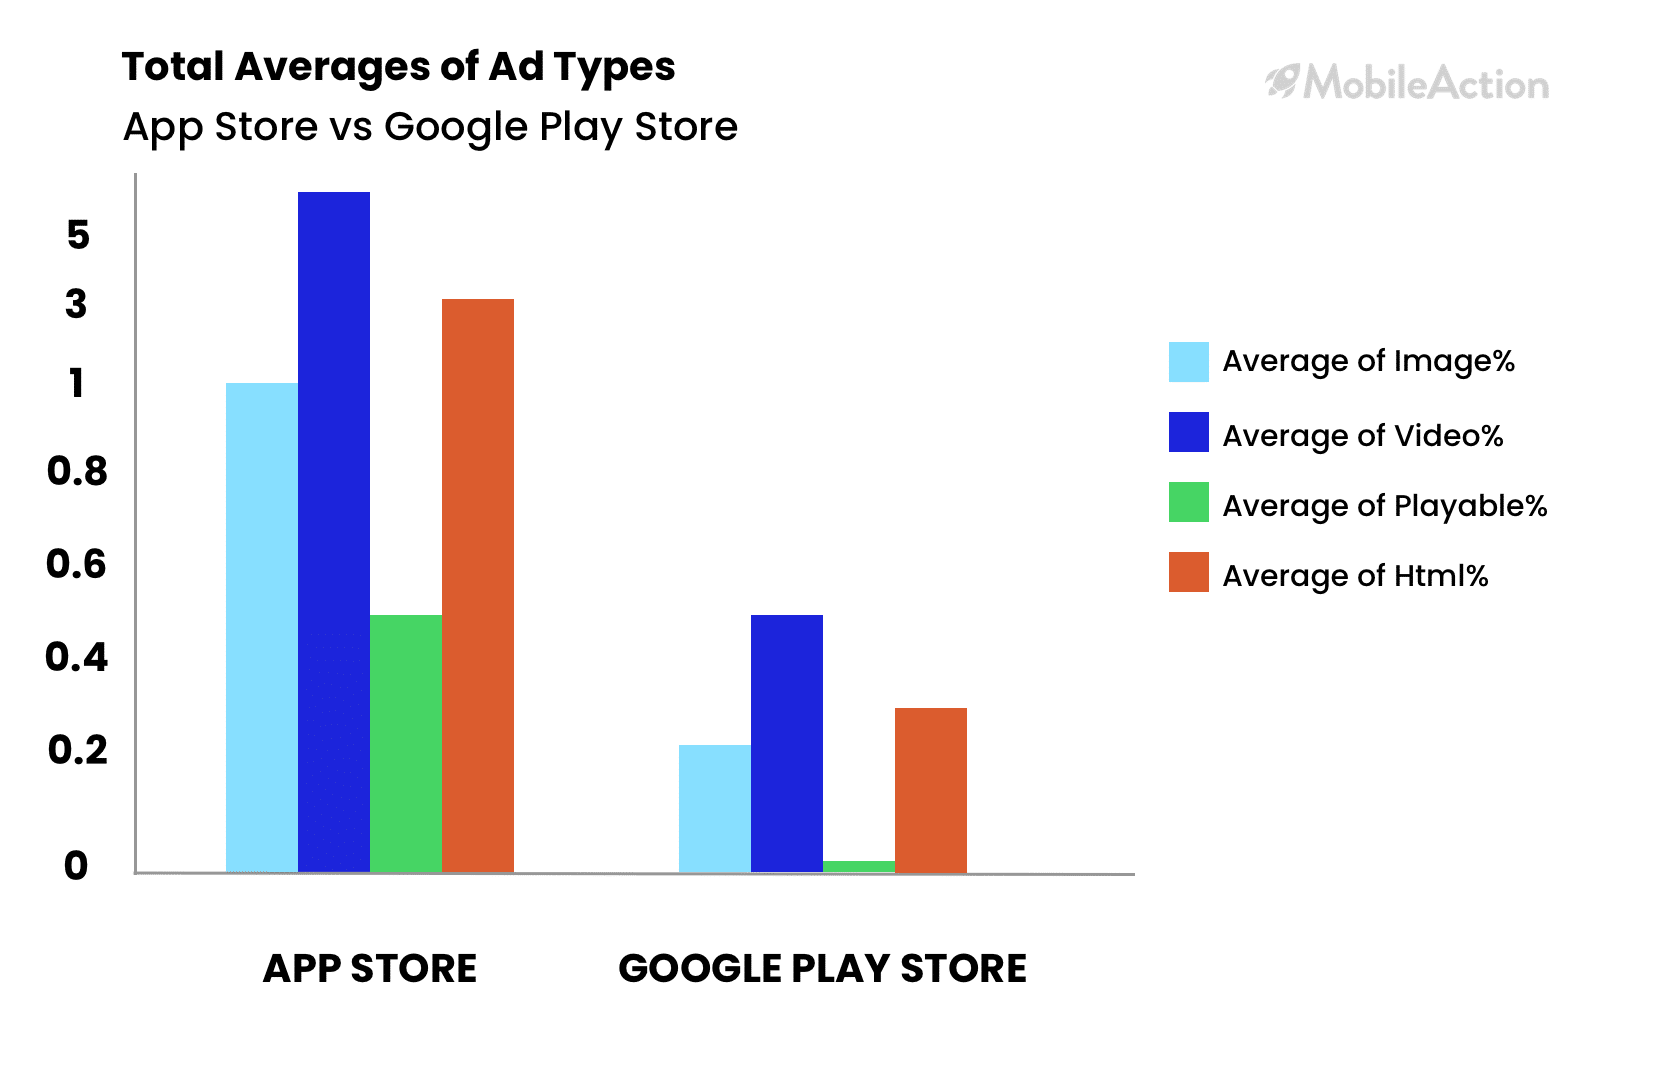
When we look at creative types in both stores, we see that one out of four creatives is image, and two out of four are video.
Let’s take a look at some Top Creatives of Homescapes (Playrix), and Candy Crush Saga (King).
Above is one of Homescapes’ top interactive creatives. We can also see how they’ve experimented with different titles and subtitles here.
Candy Crush Saga also does a good job at showing the real game play and is straightforward.
Publisher Counts
The most important thing while building your ad strategy is making sure that your ads are seen. The more ad networks and the more ads you use (assuming you have a solid app in your hands), you will end up with a product that firstly has a high impression and as a result a high revenue with it. This might be a key point for UA Managers to keep in mind, so straighten your back and pay attention 🙂
Let’s have a look at the Publisher Counts for the publishers and the apps.
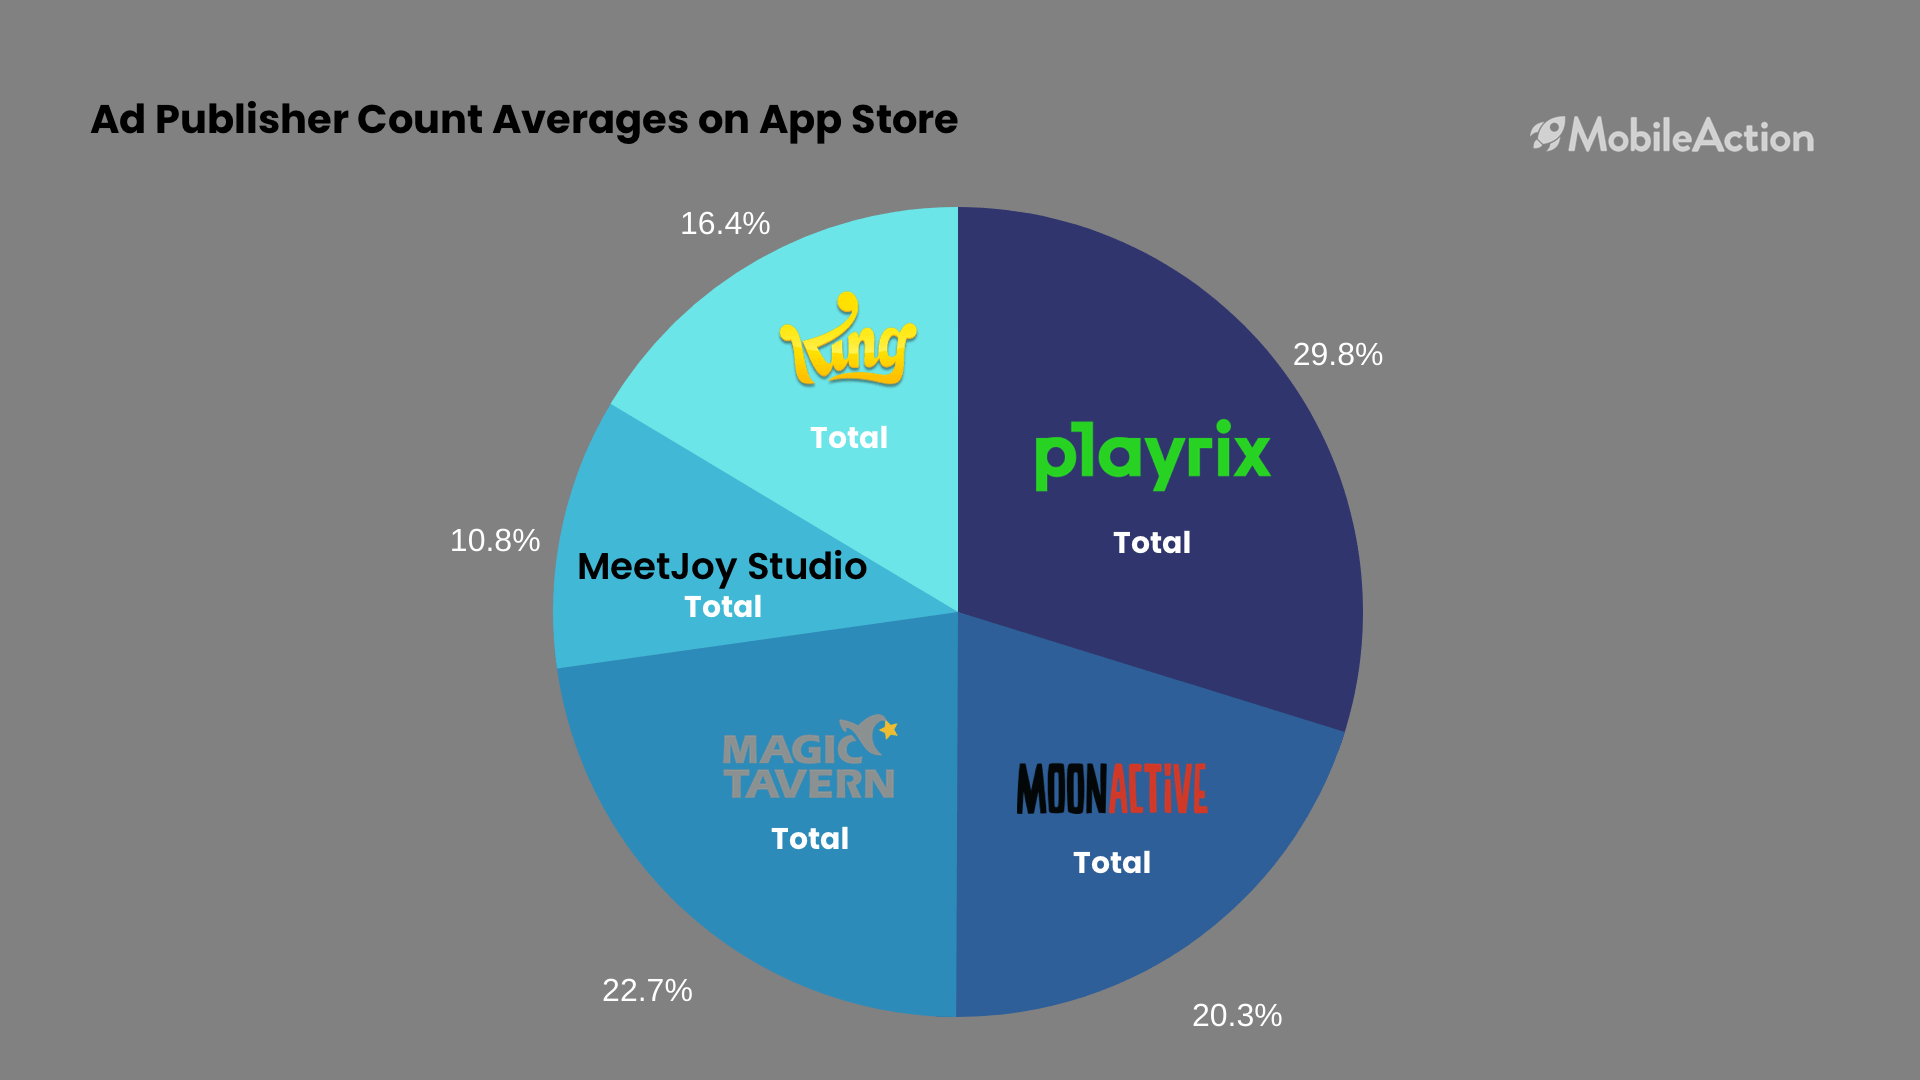
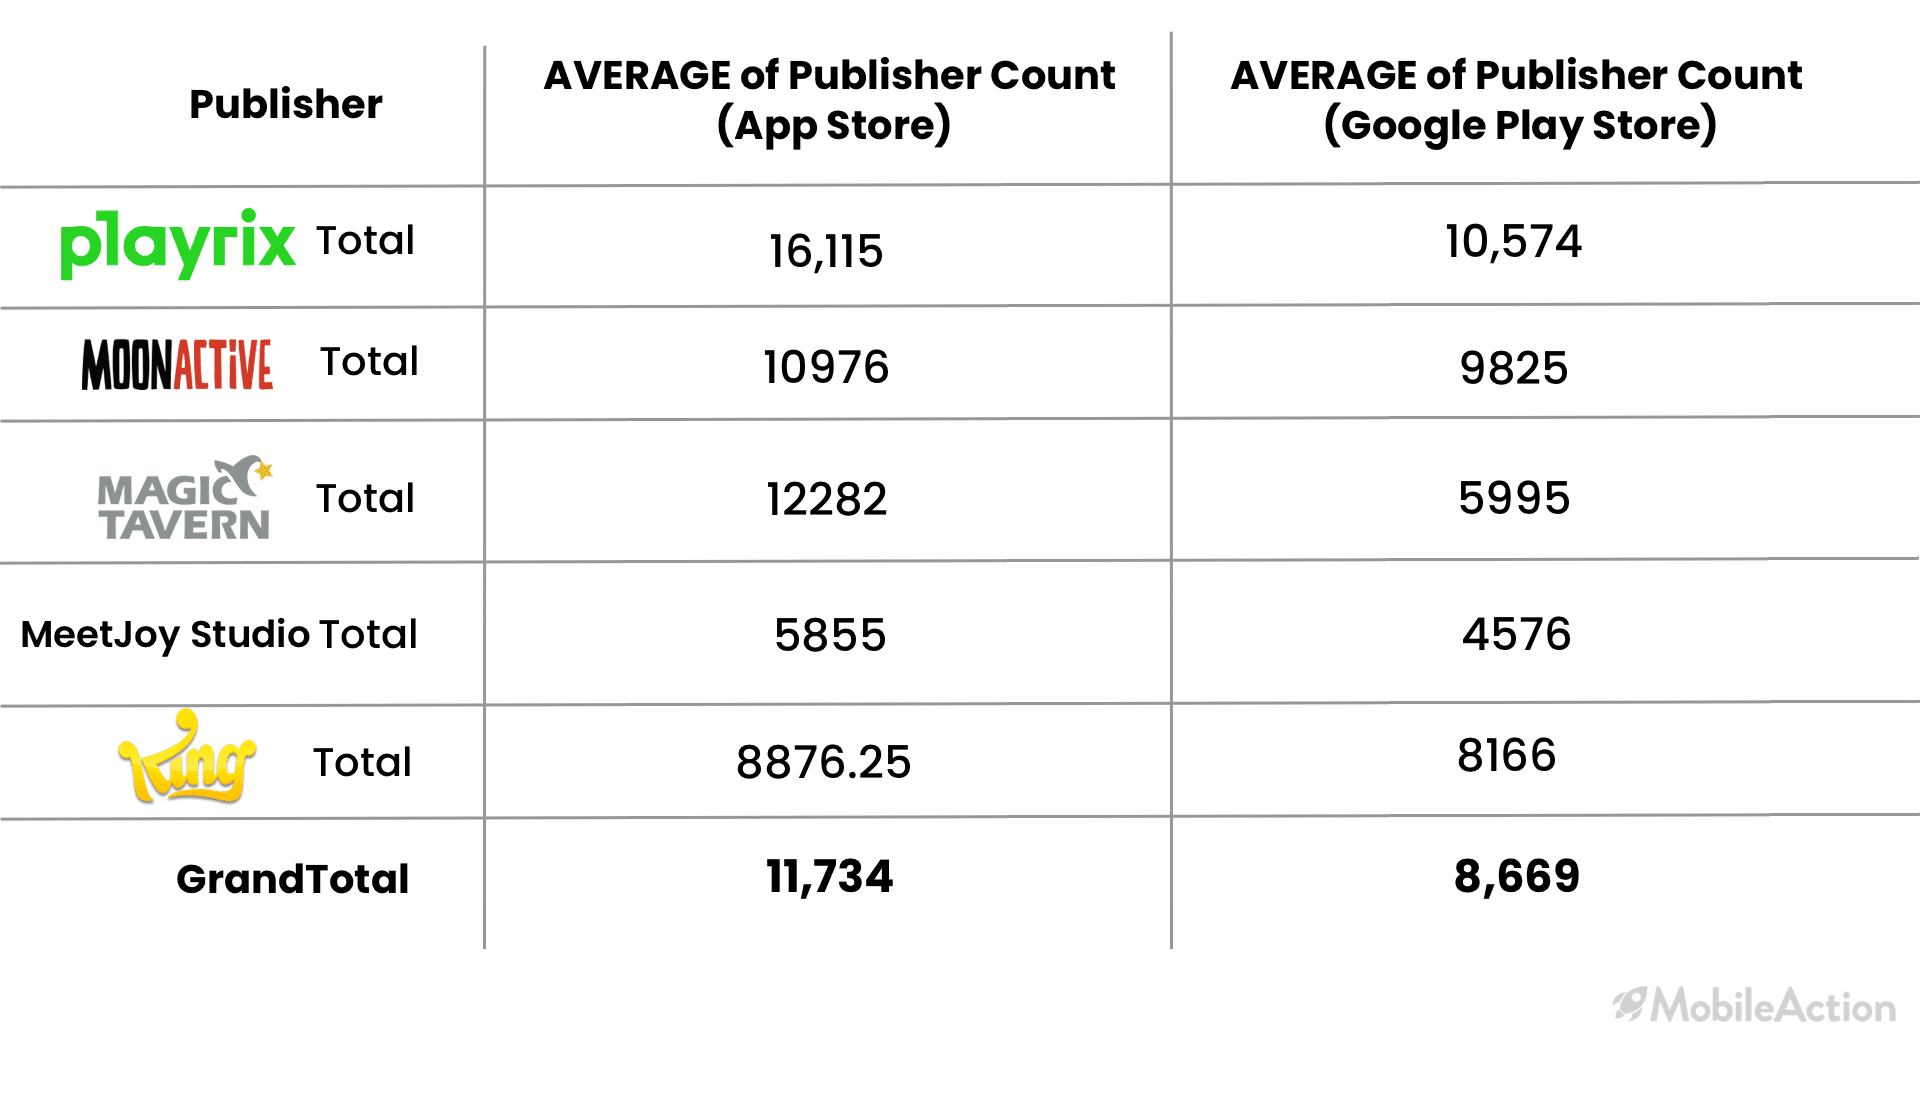
Starting with the graph for the App Store:
And here is the graph for the Google Play Store:

When we compare the Ad Publisher Counts on App Store vs Google Play Store, we see that all publishers besides Playtrix and Magic Tavern seem to have a higher publisher count for Google Play Store. Magic Tavern has the biggest difference. This may be because their game gets more ROI in the app store, so they are focussing their efforts there instead.

Category Rankings For Casual Game Publishers
Category rankings of these three publishers (for their three apps) are analyzed below.
The App Store
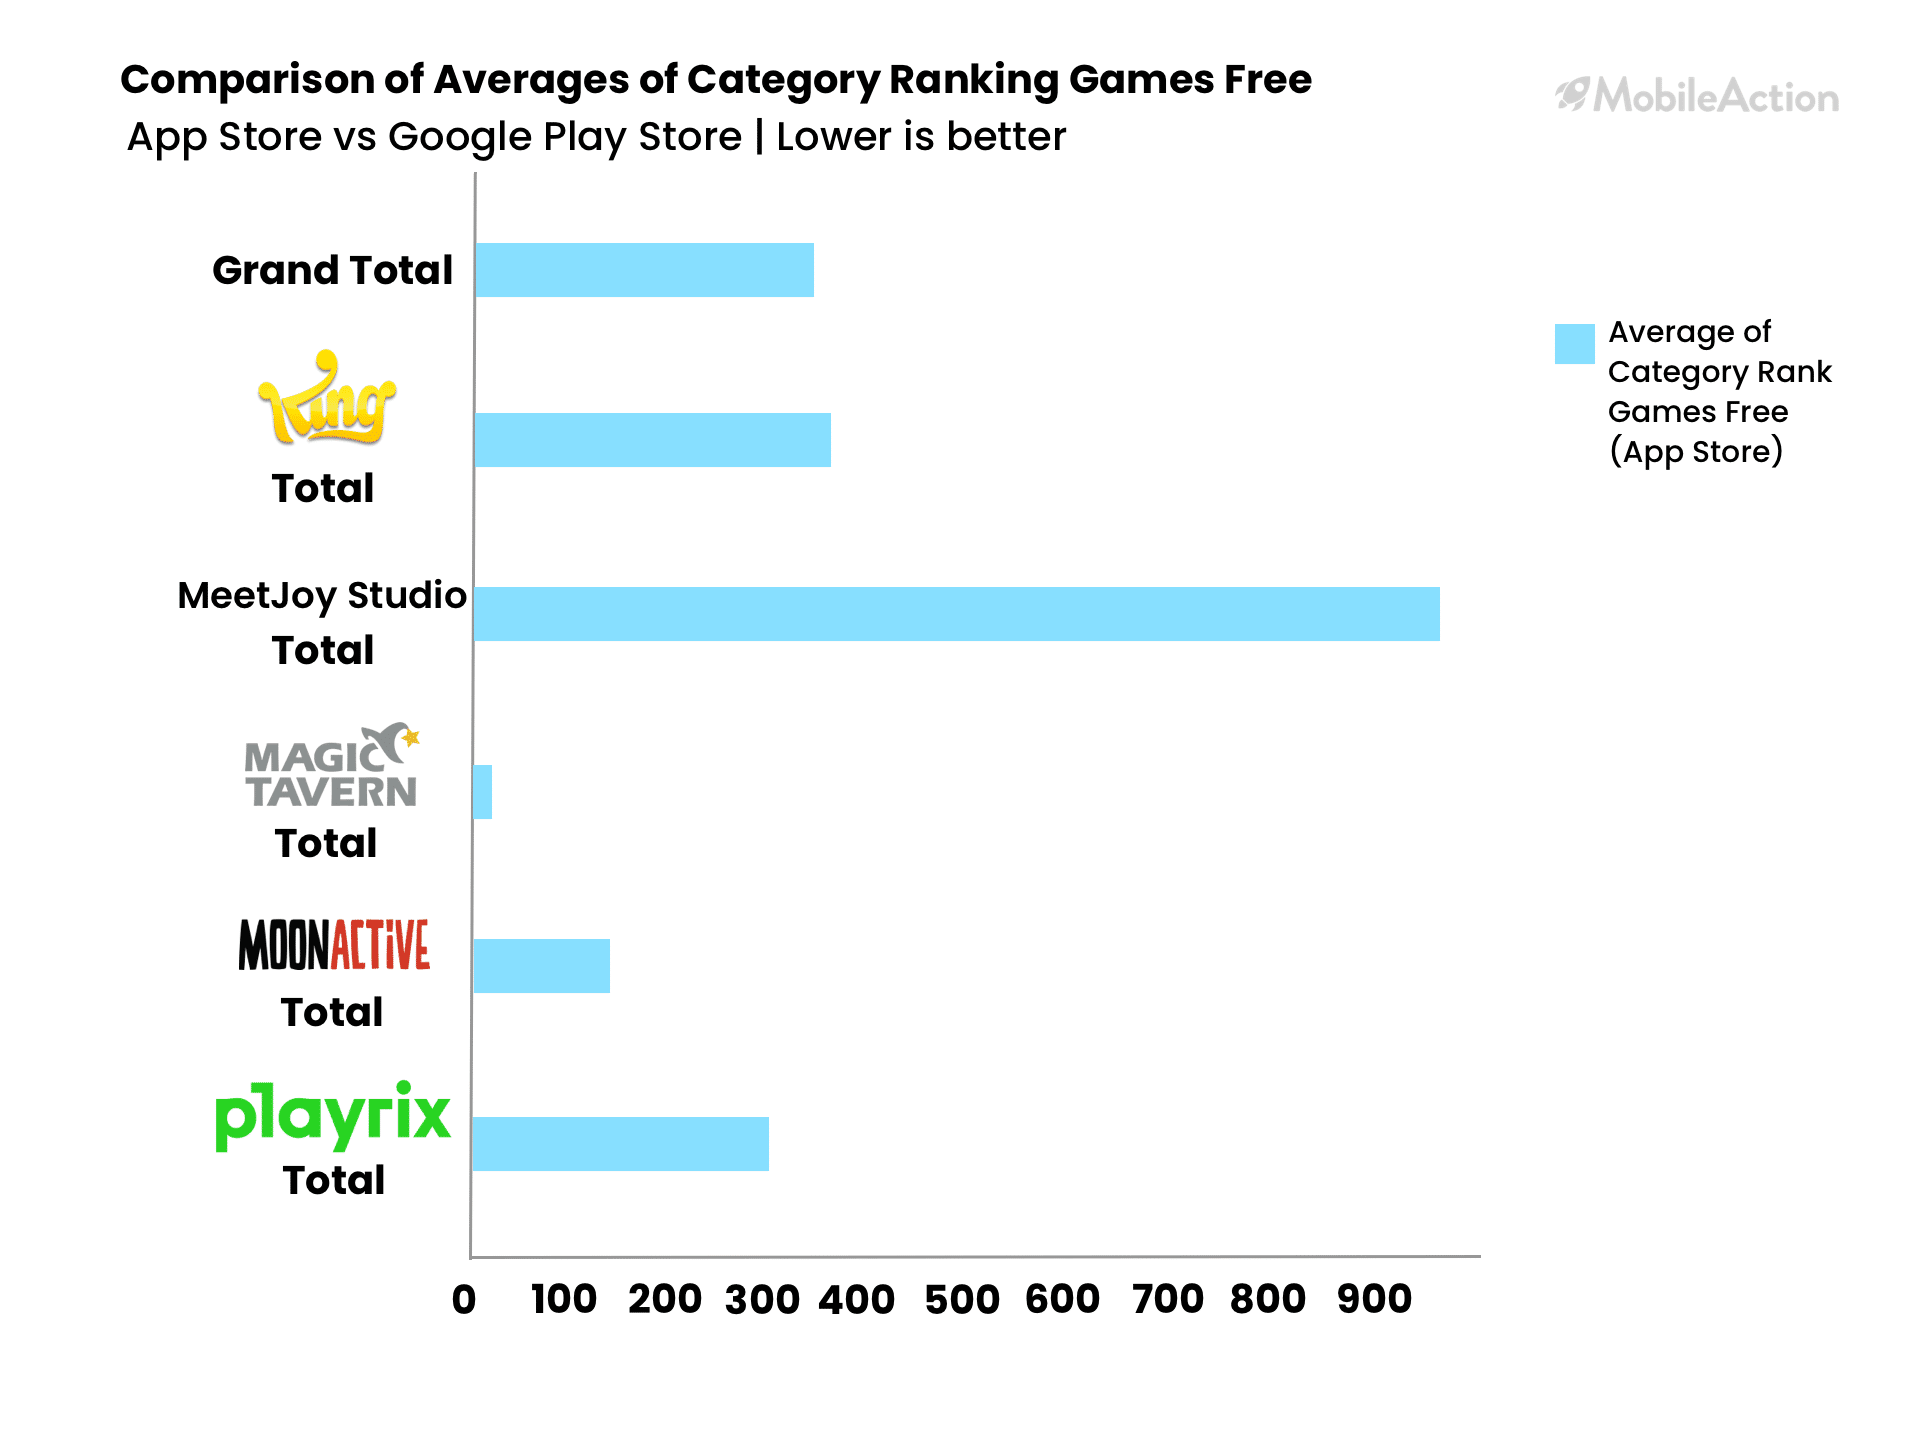
Here we can see that the average category rankings of MeetJoy Studio games seem better than the others. However, we are evaluating fewer total games from Magic Tavern and Meet Joy Studio. Having one well-performing game affects them in this respect.
The Google Play Store
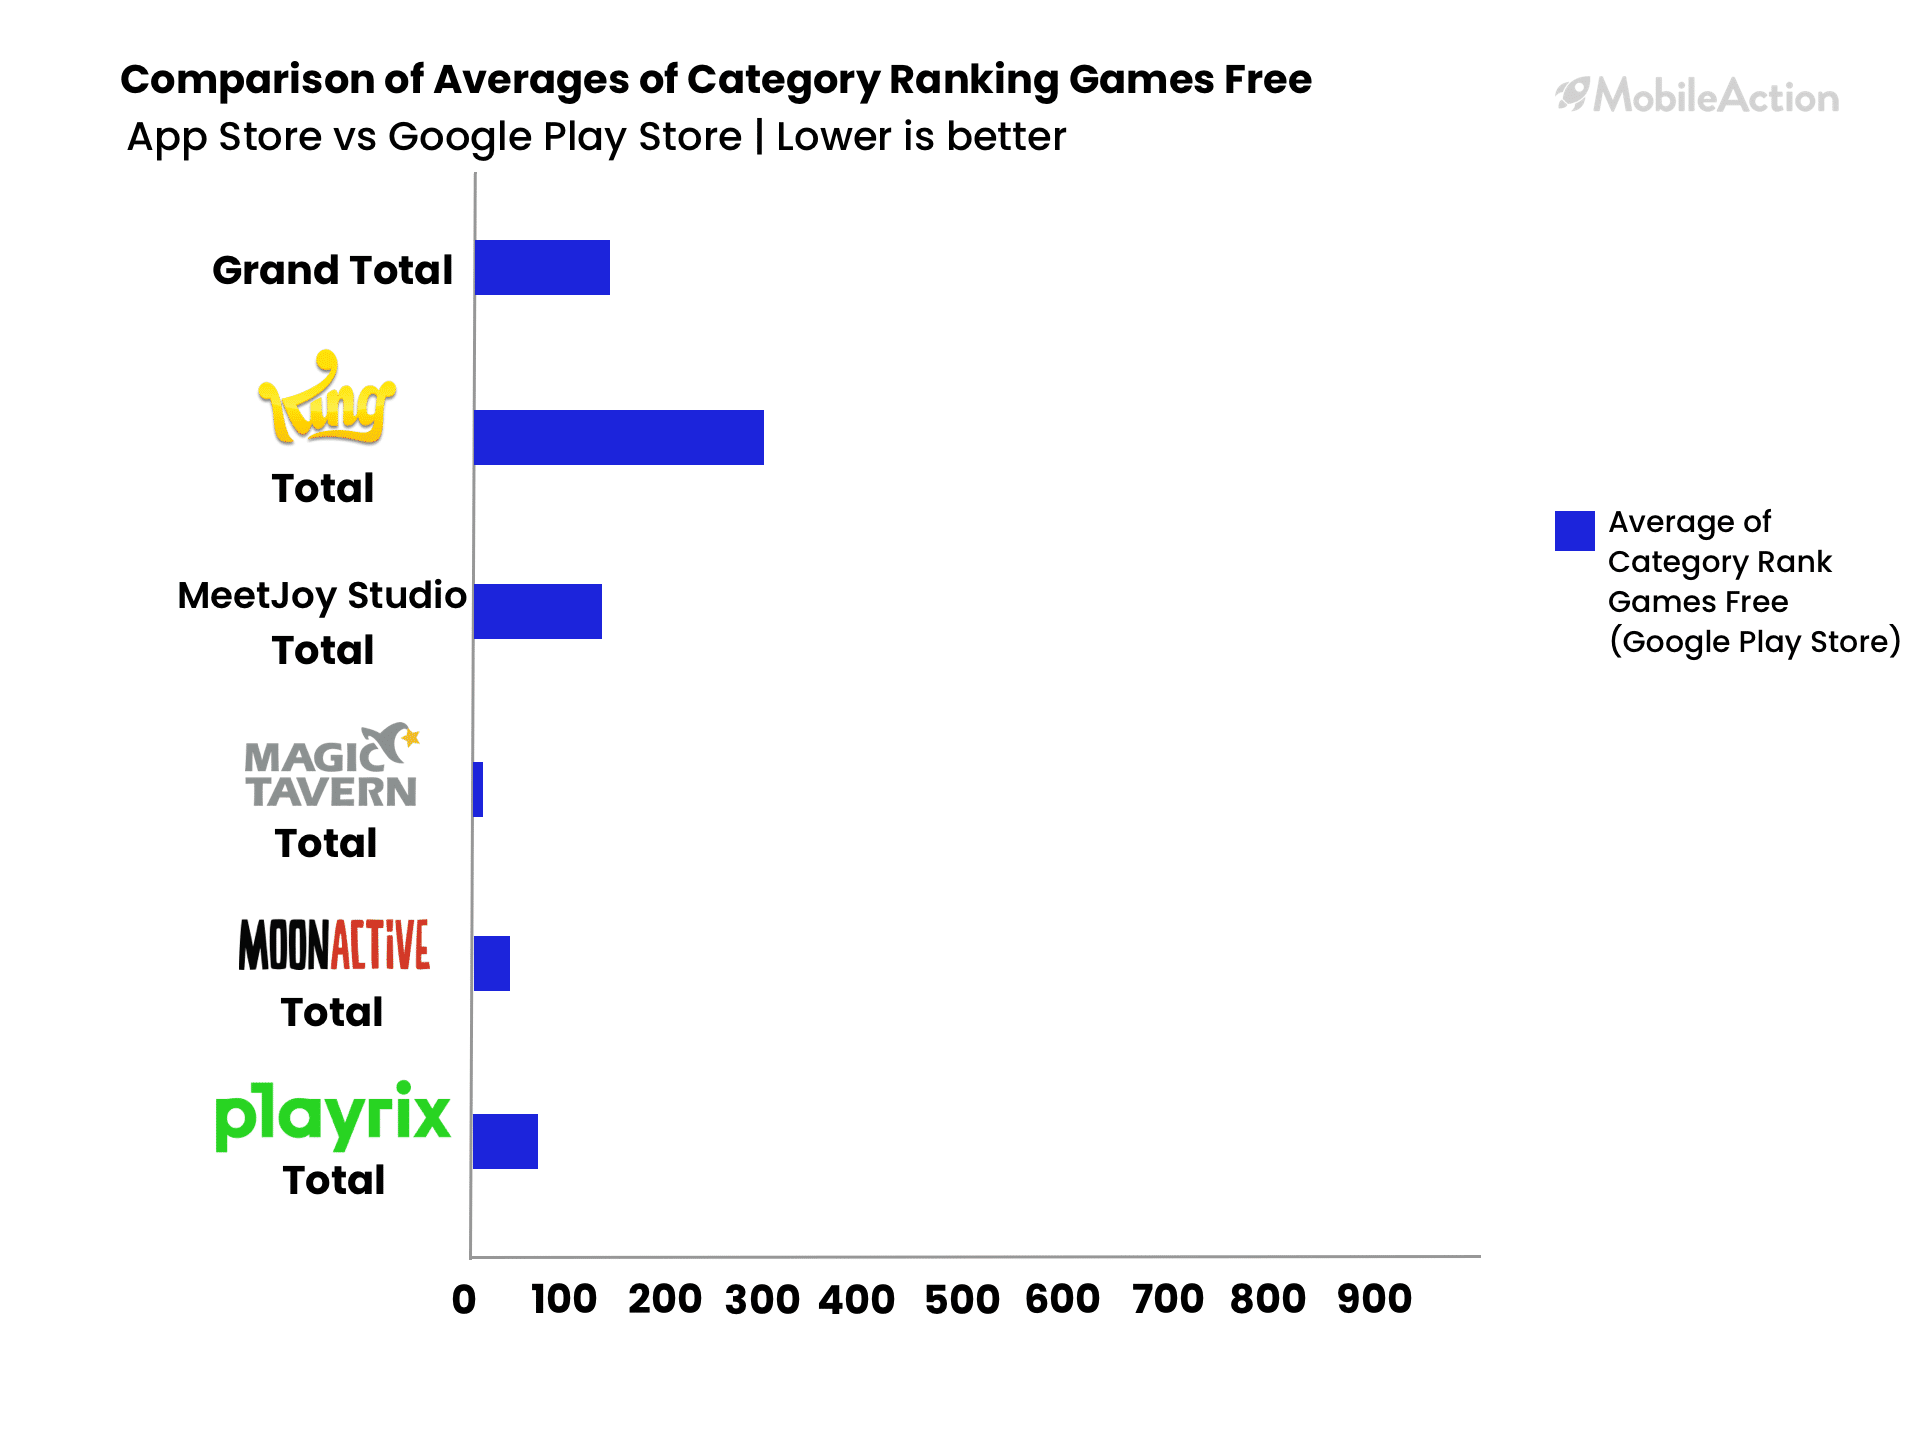
King games averages are better on Google Play Store again. However, the difference is negligible.
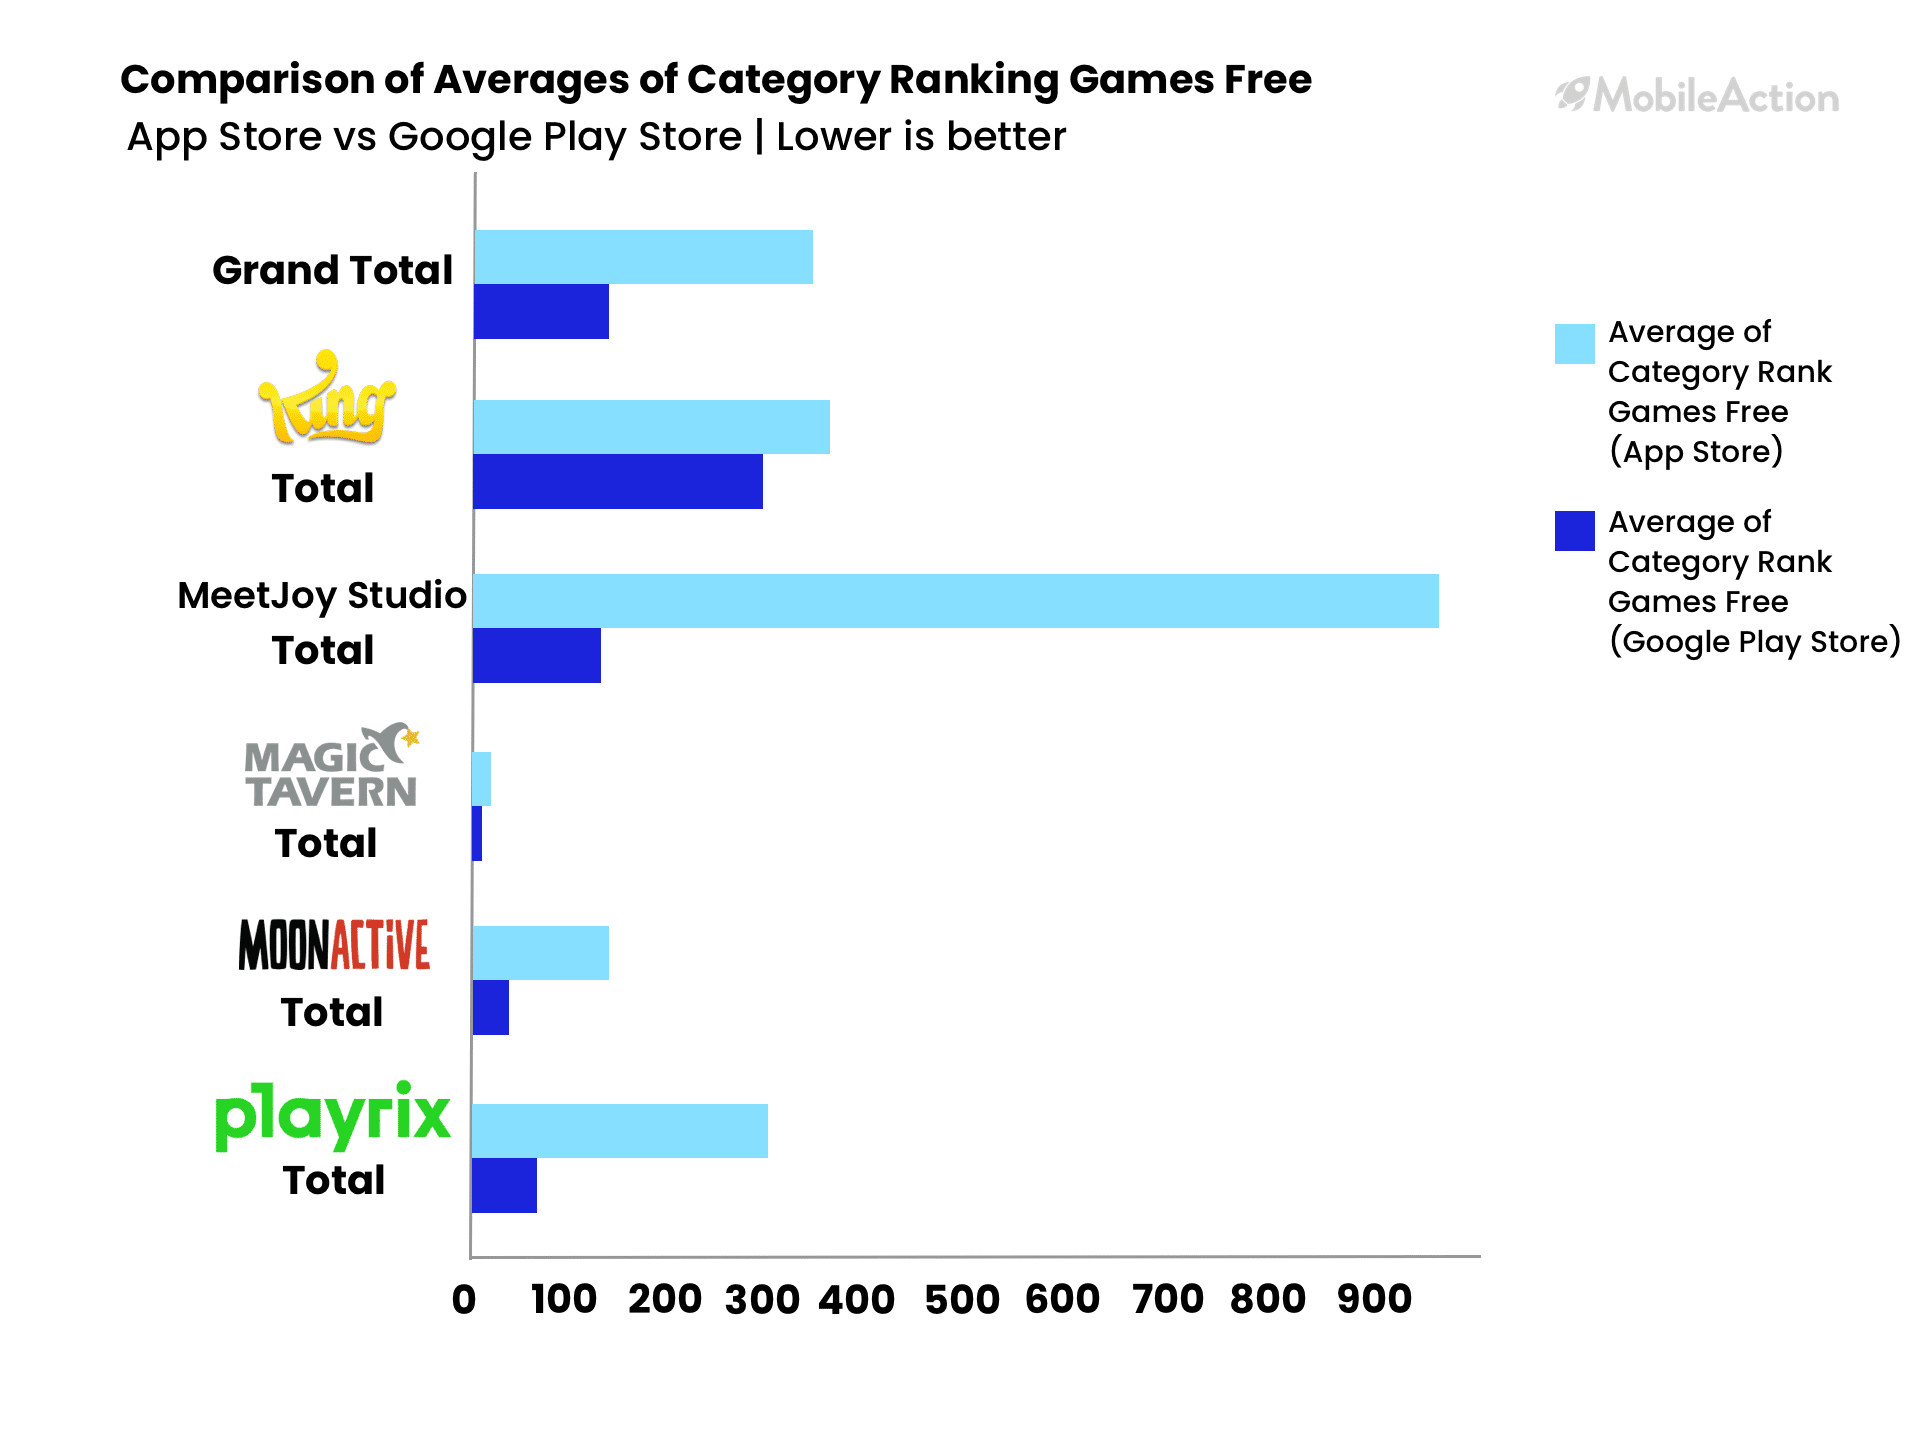
Now let’s see the total averages of category rankings!
Ad Networks
Ad networks play a bridge role between advertisers and publishers and hence they’re important in coordinating the distribution of creatives. Seeing what ad networks Top Publishers use, might help you in deciding for the future.
App Store
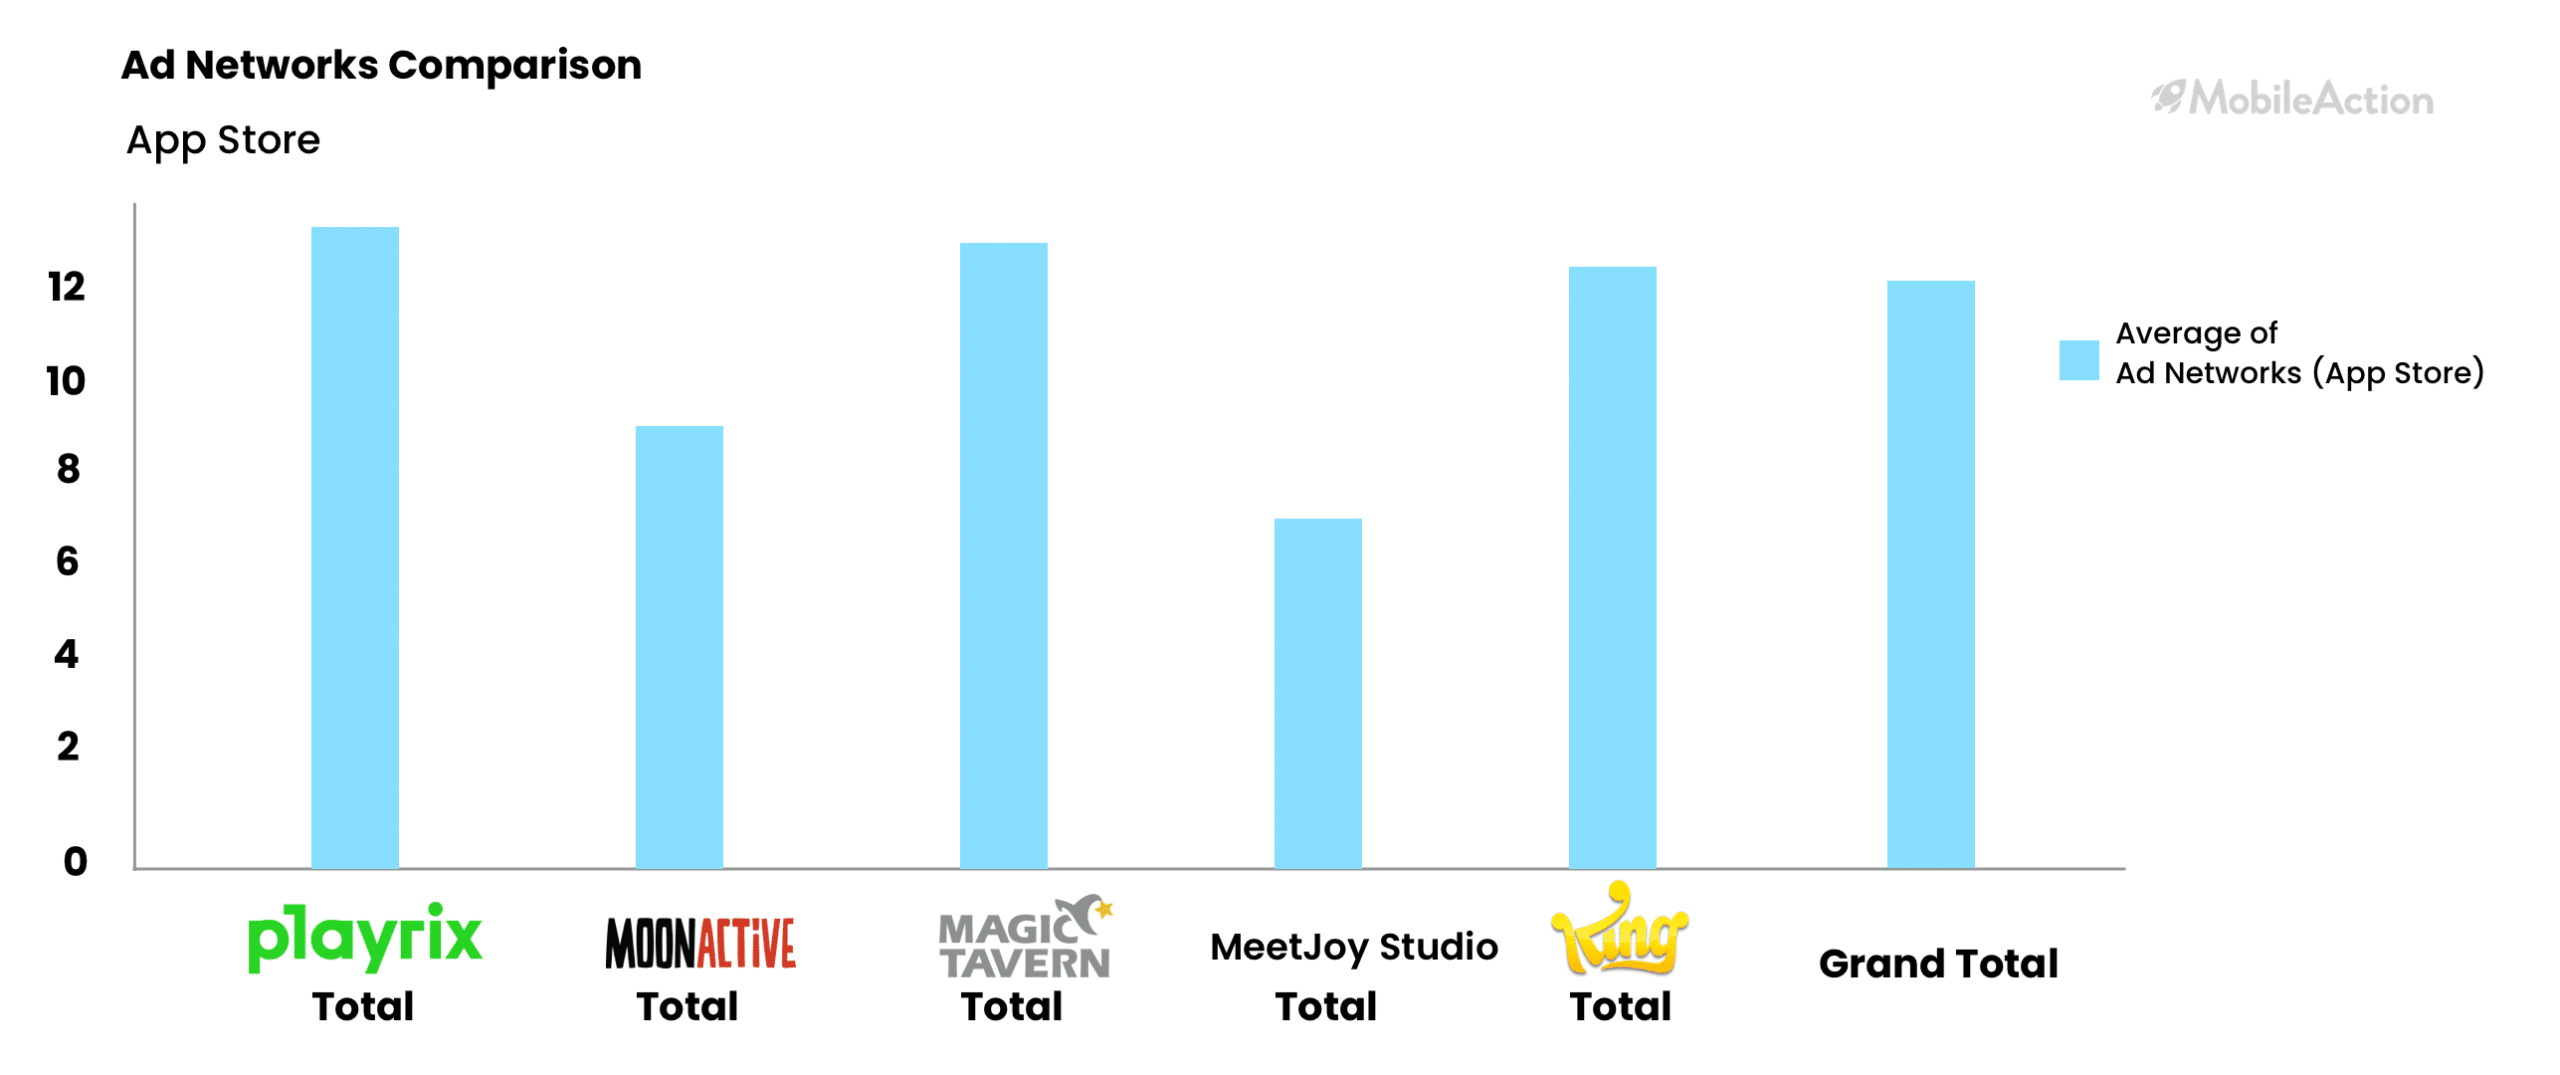
As seen in the graph above, Playrix uses more Ad Networks than the others. Magic Tavern is pulling in at a close second. This helps in distributing their ads widely.
Google Play Store
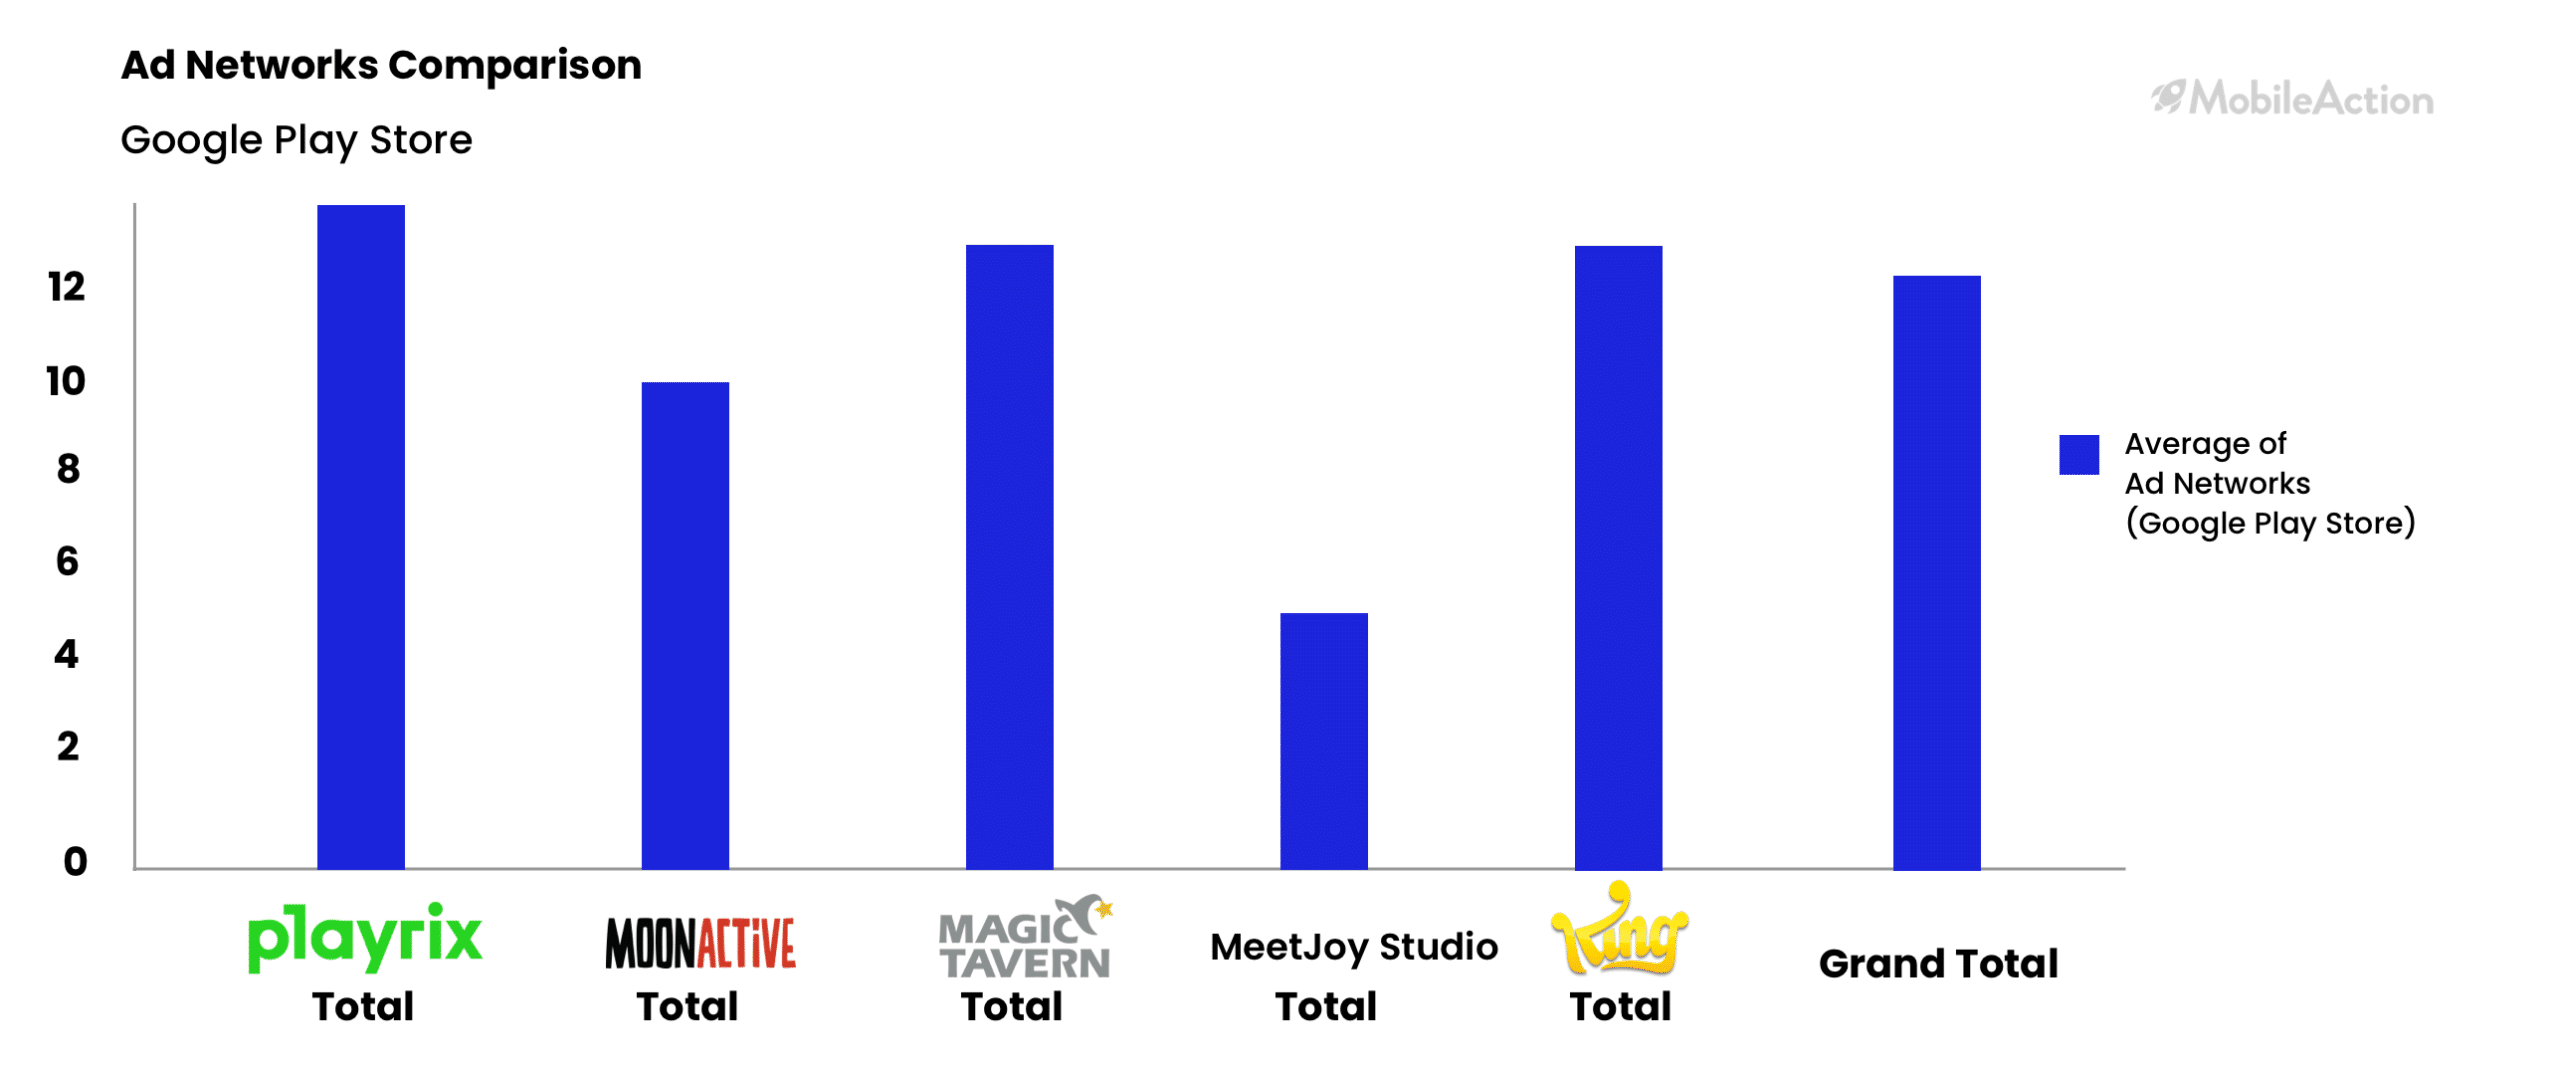
On Google Play Store, King, Playrix and Magic Tavern seem to be head to head, while MeetJoy is less aggressive than the others. When looking at creative trends in casual games for Ad Networks, you may also want to take note of what specific sub-genre your game falls into. This can have a big impact on how useful that Ad Network is for you.
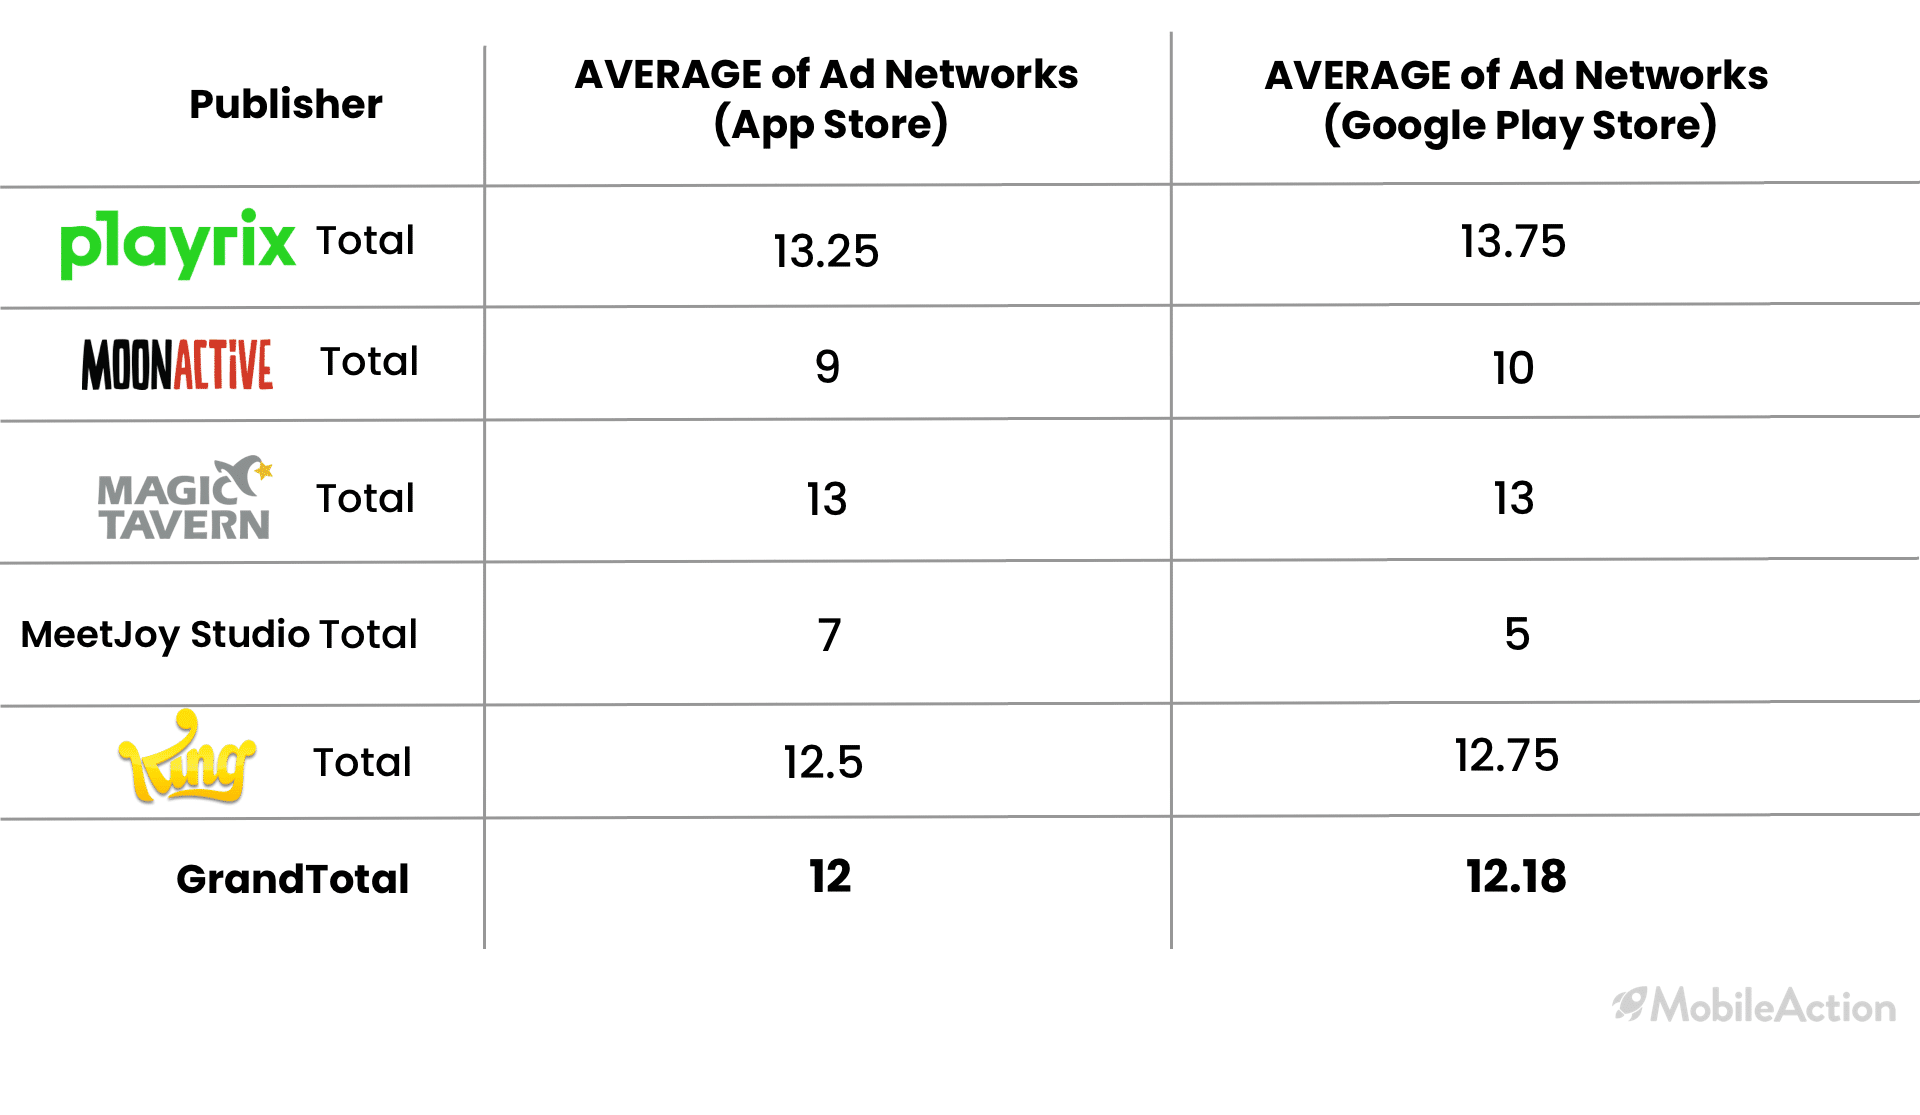
Comparison of Ad Networks for casual games
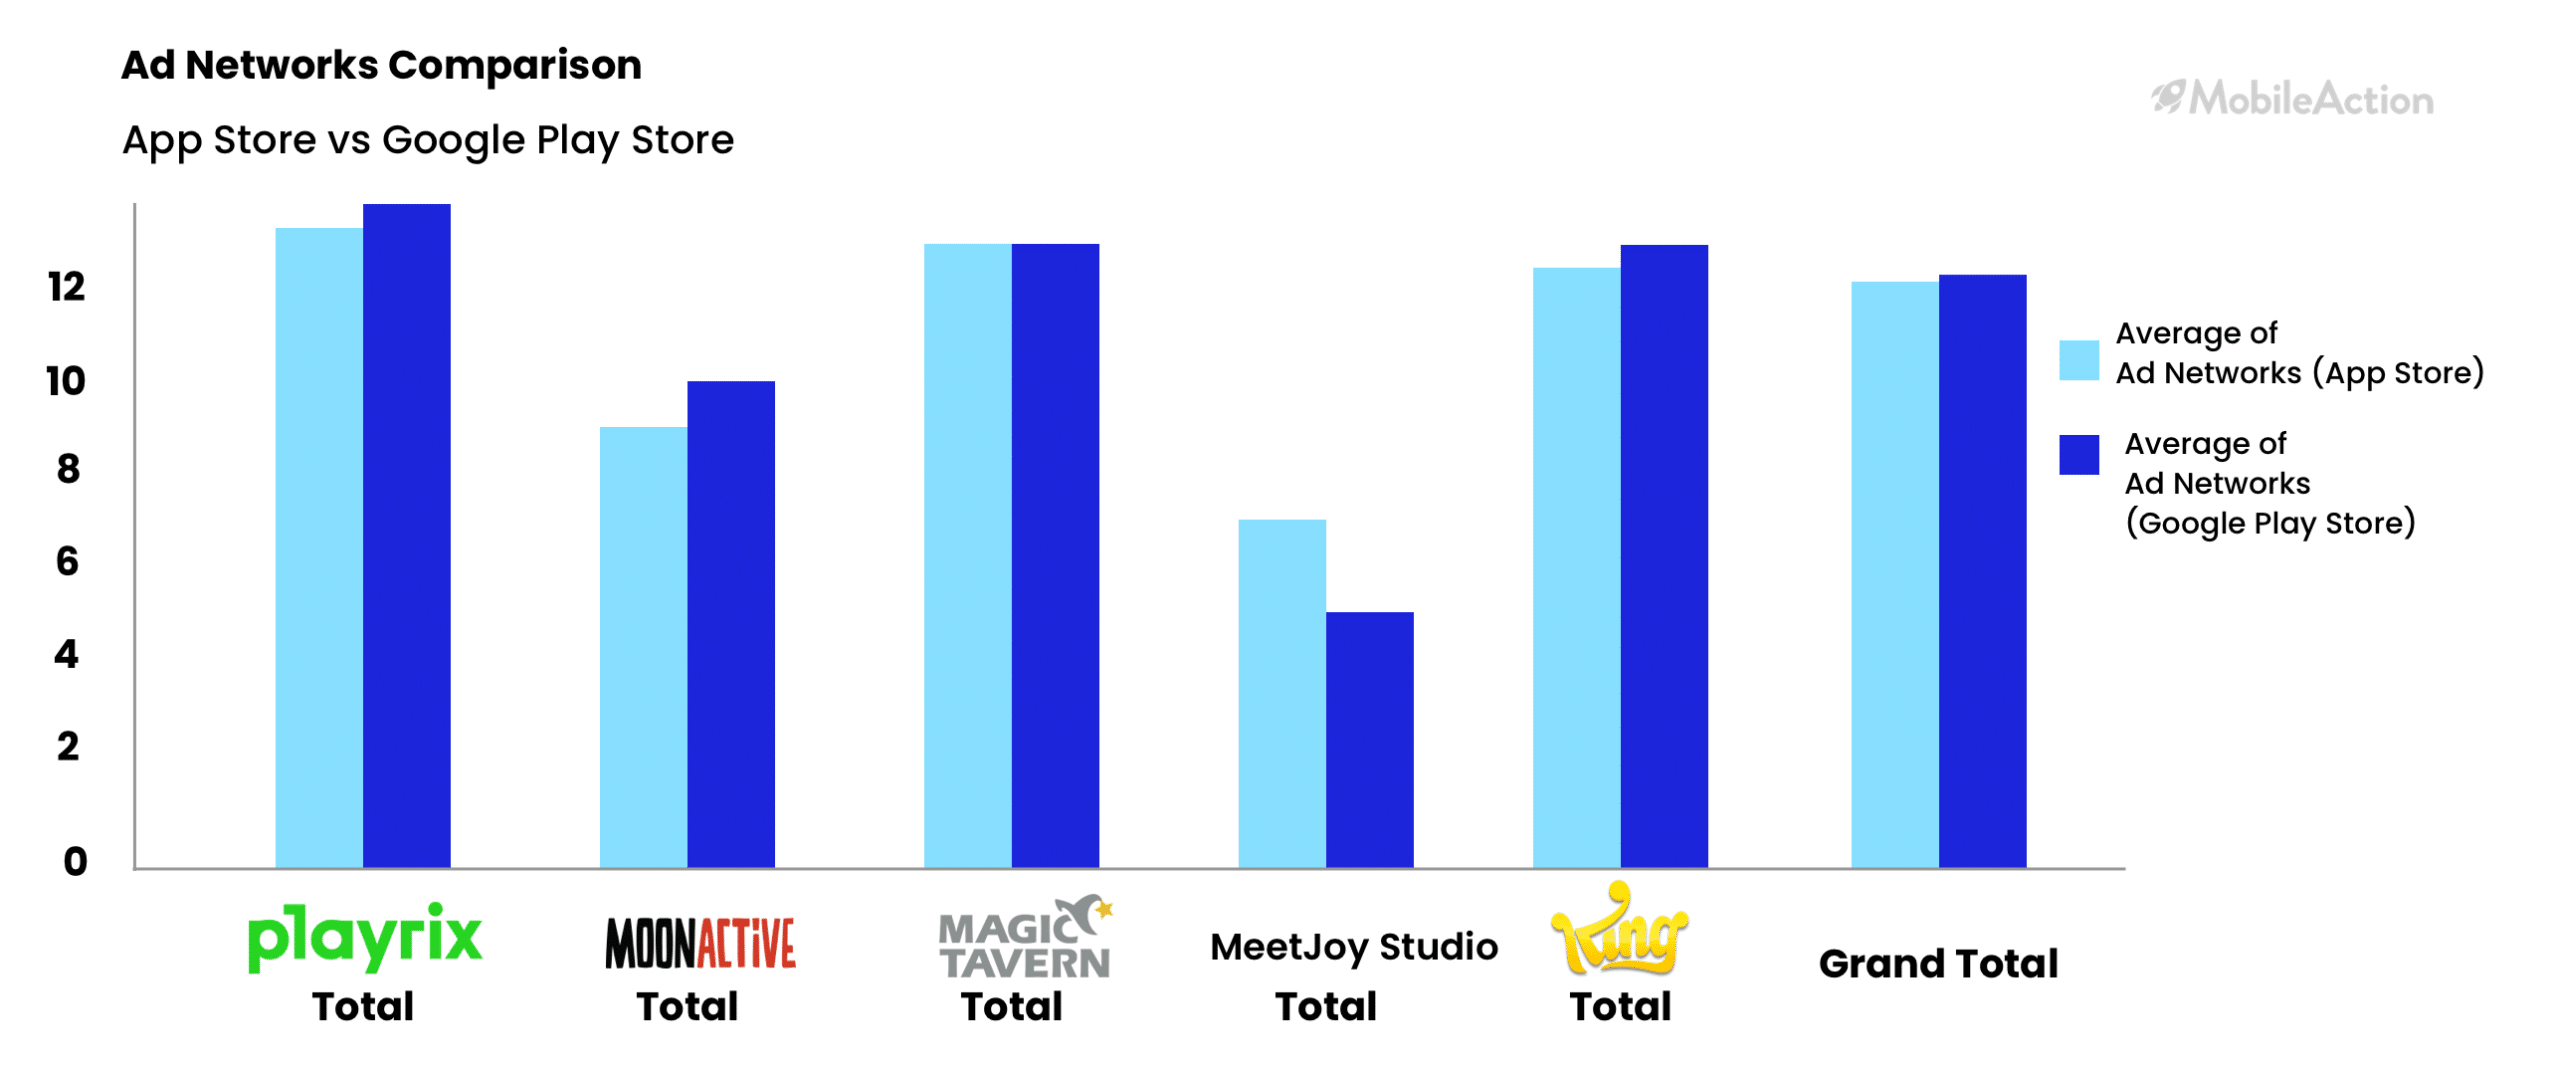
App Store vs Google Play Store
Total averages show us that Playrix is the most aggressive with using Ad Networks, it’s above the average on both app stores. However, MoonActive is coming in a close second.
Which Ad Networks are trending for casual games
Most preferred Networks by the Publishers are listed below.
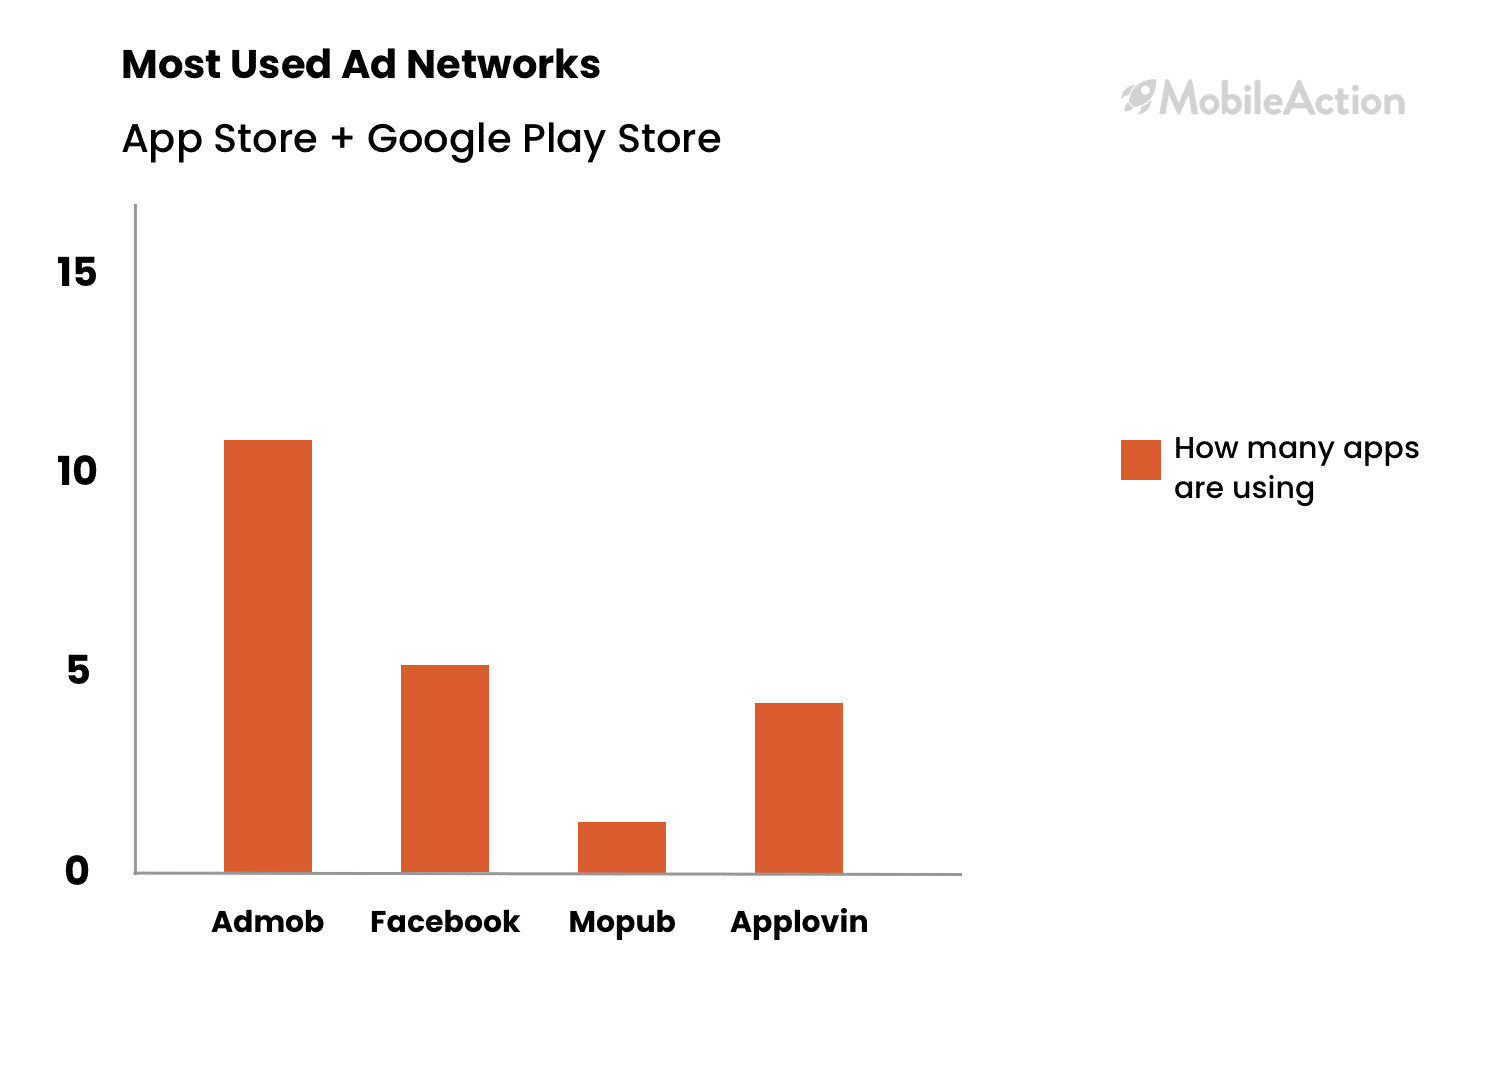
Overall, Admob seems to be the preferred Ad Network.
What to Takeaway From Top Publishers like Playrix, Moon Active, Magic Tavern & King
- Using a lot of Ad Networks and being aggressive with in-ad strategies.
- Having not just a lot of creatives but enough active creatives.
- Using different types of creatives, especially videos and interactives to attract user attention.
We hope you enjoyed our report. Every UA can come up with a strategy of their own, however, it might not always be enough to succeed in the market. To be able to compete with a-class games, you should be keeping track of trends and constantly know what your competitors are up to. We tried to give you some tips from Top Publishers in casual games by analyzing their best performing games and their campaign metrics.
We wish you luck in building up your next strategies. To do an analysis like this for any app from any category schedule a demo with us.