


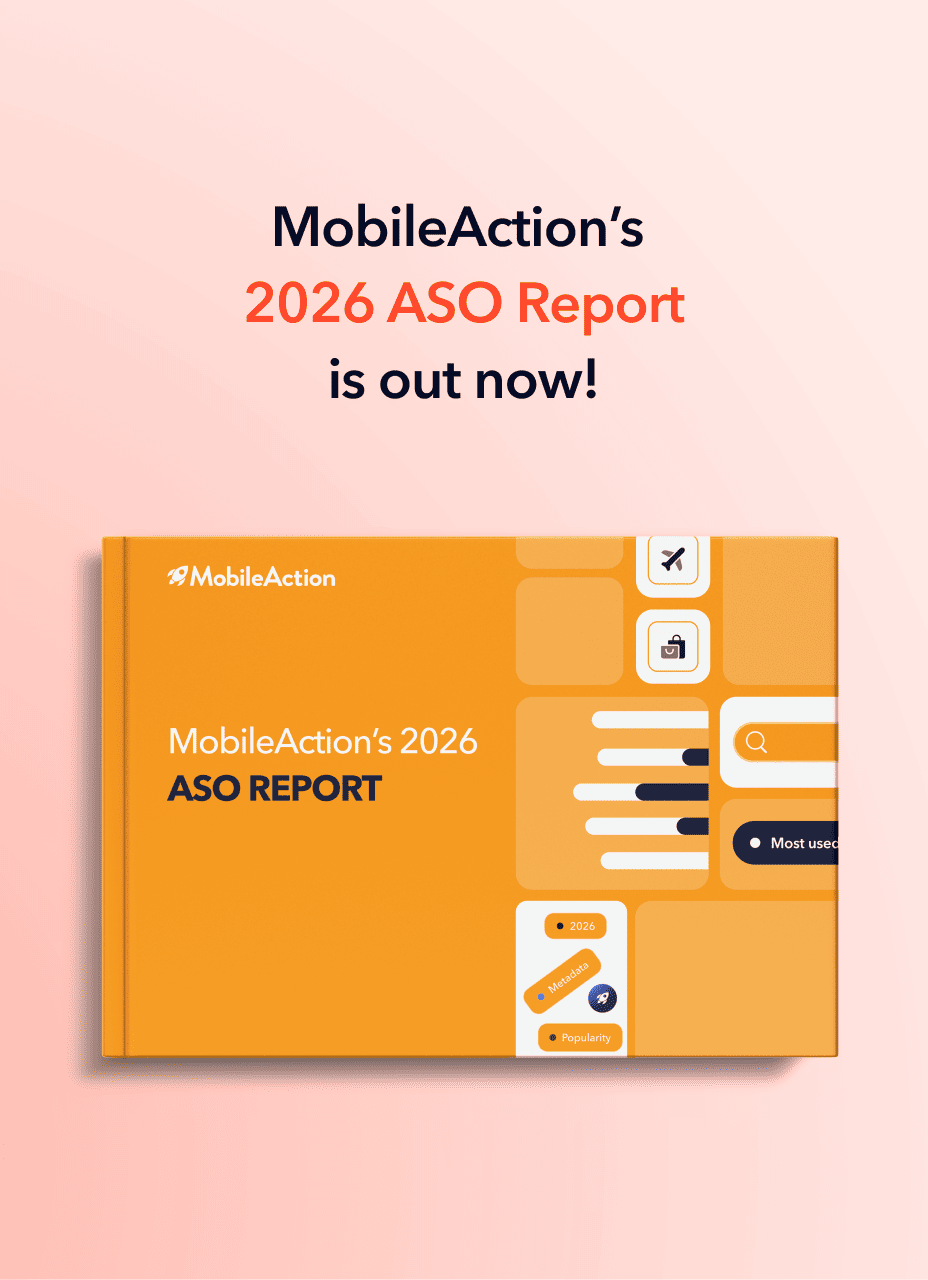
Looking to boost your app's visibility and acquire more users? Our 2025 ASO Report is your ultimate guide to navigating the evolving app store landscape. Packed with data-driven insights, keyword trends, and top-ranking app strategies, this report will equip you with the knowledge to optimize your app's presence and achieve organic growth.
If you can’t track it clearly, you can’t improve it.
Whether you’re reviewing performance with your team or reporting to stakeholders, understanding your revenue trends across app stores is a non-negotiable. But when that data lives in different dashboards (and comes with formatting headaches), it’s easy to miss what matters.
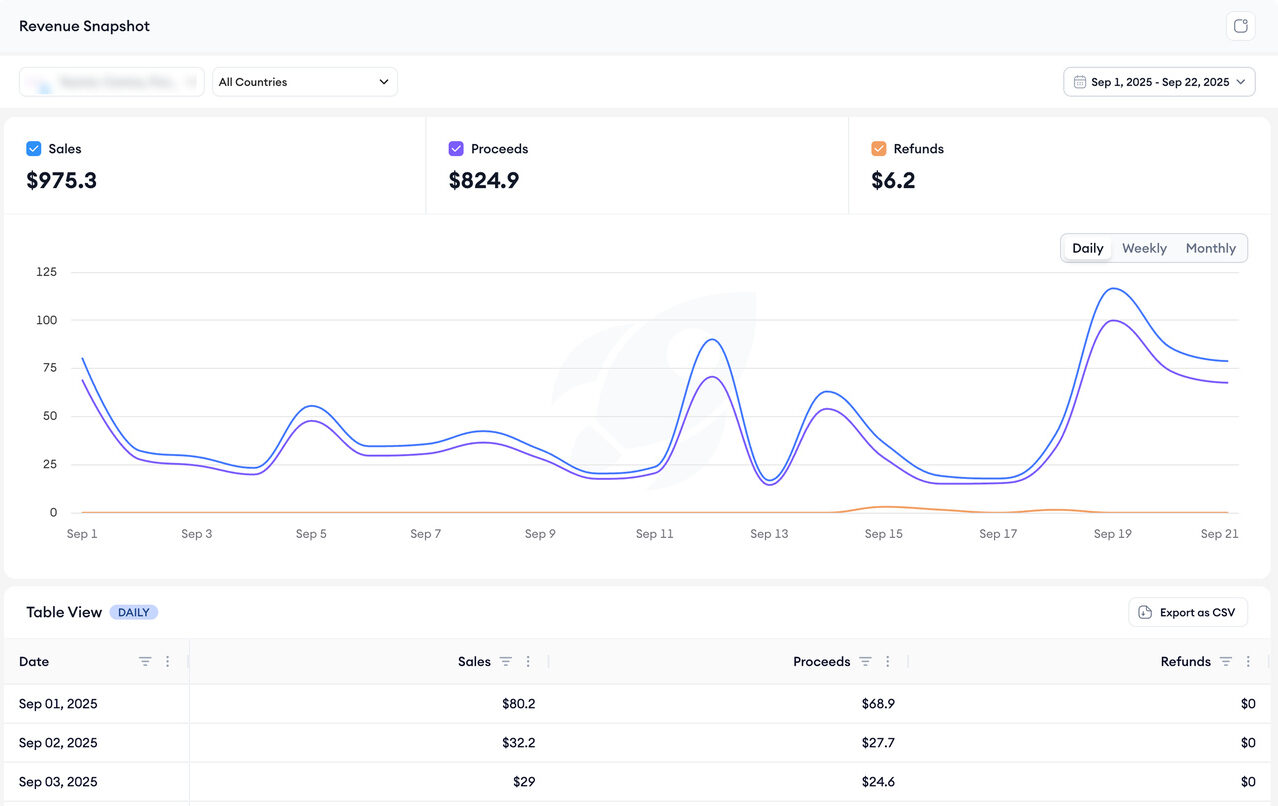
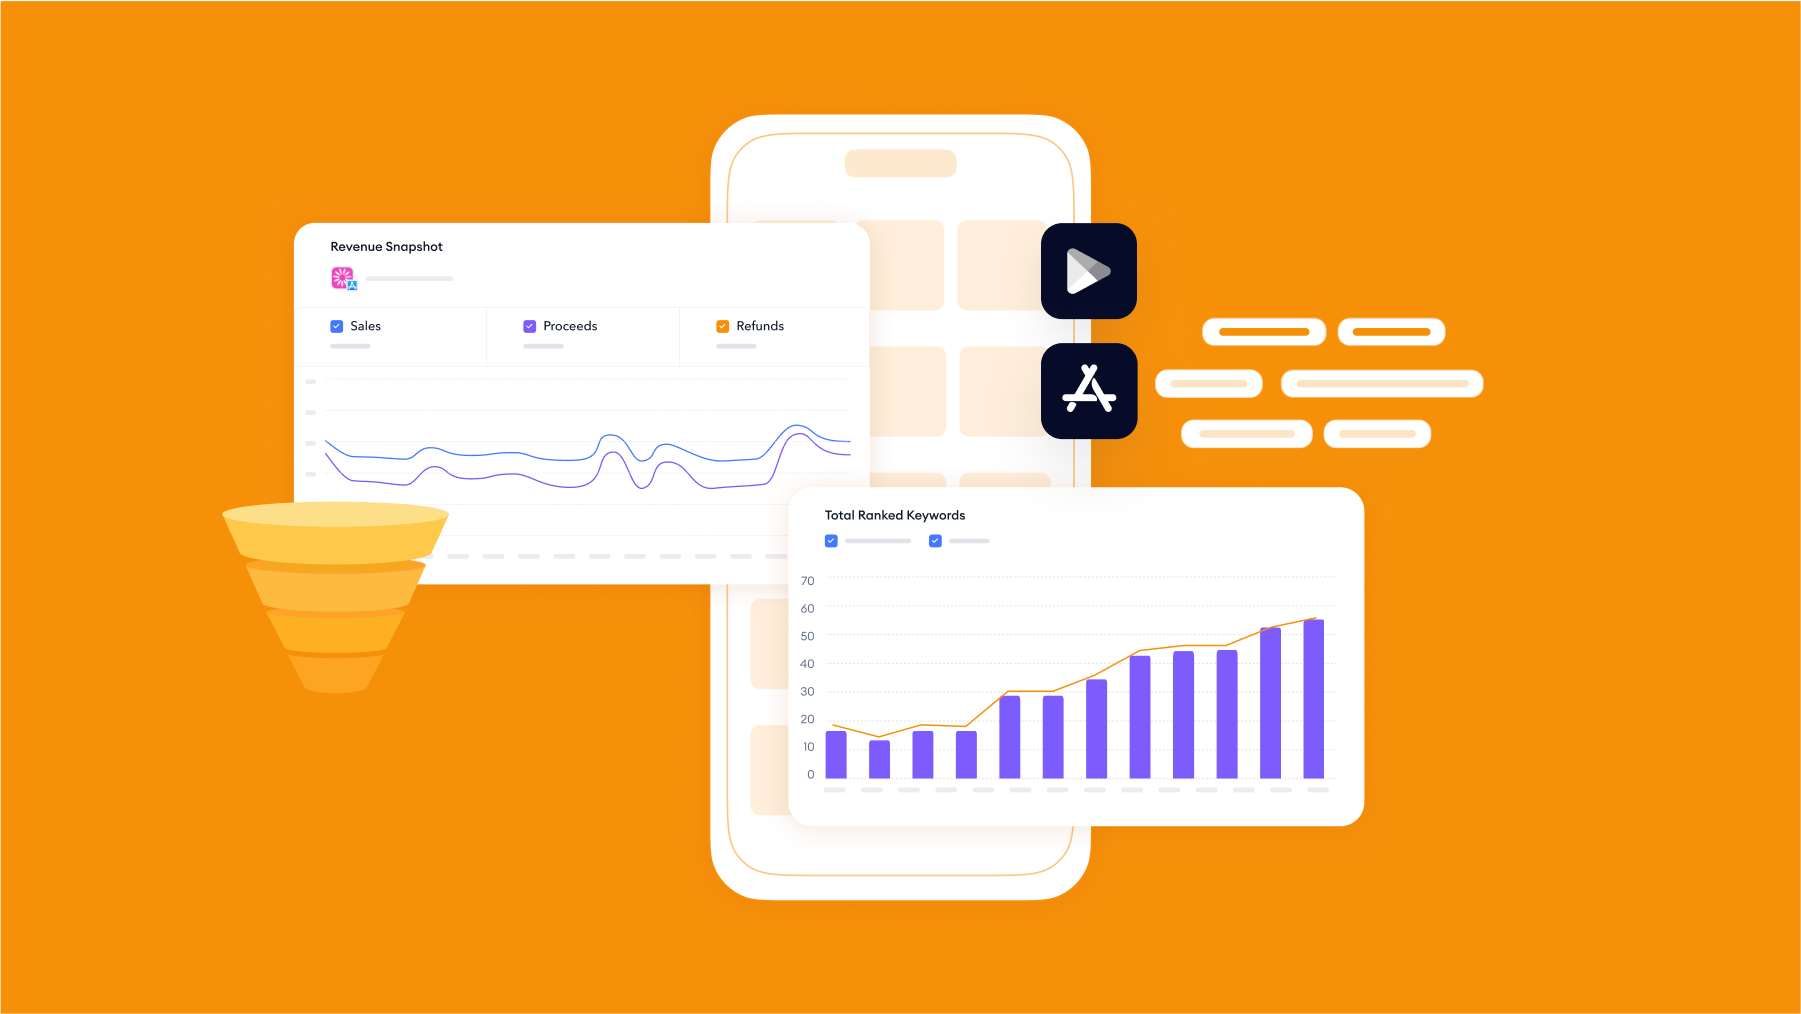
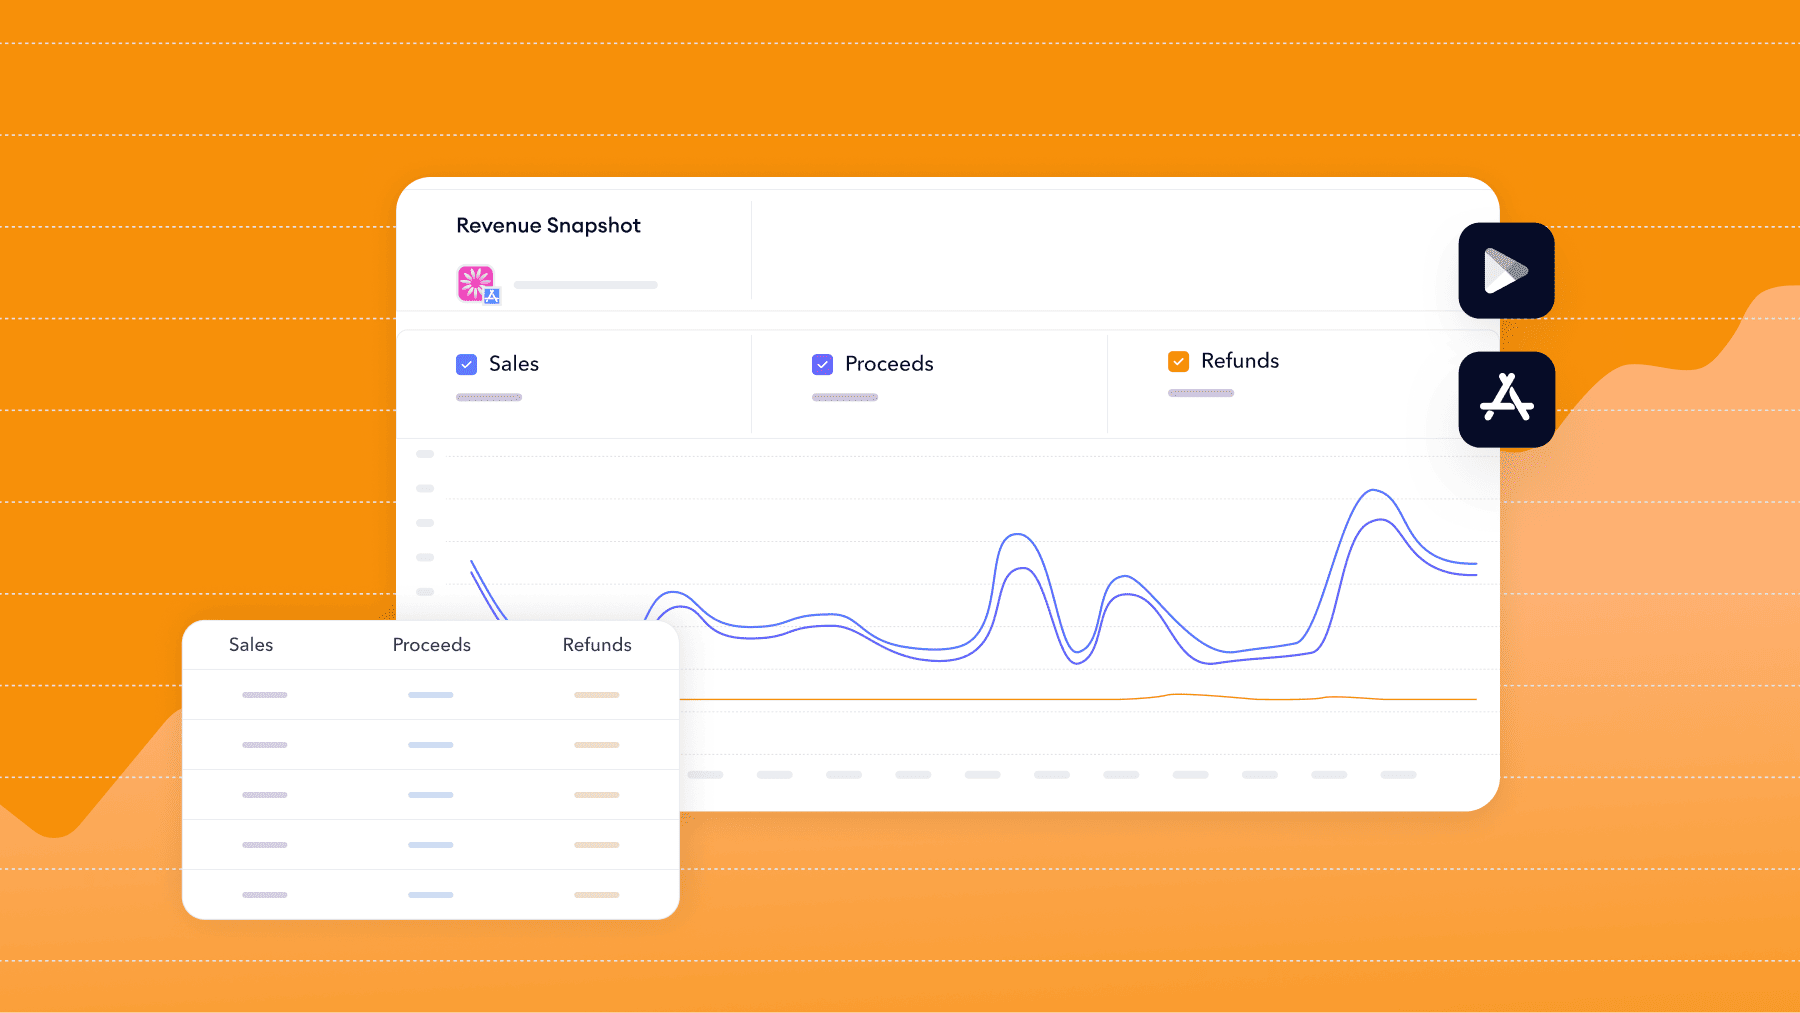
Revenue Snapshot is built to give you full visibility into your app’s earnings, from total sales and proceeds to refunds. It’s a smarter way to monitor revenue patterns, detect unusual changes, and share clean, consistent numbers with your team.
Why we built it
Revenue is the outcome of every choice you make, from campaign strategy to product updates. But reporting on that outcome has been harder than it should be.
Teams were stitching together exports, switching between dashboards, and spending hours preparing reports that still left questions unanswered.
We built Revenue Snapshot to give you a clear, structured view of your app’s earnings; one that supports better tracking, smarter analysis, and faster reporting.
With it, you can:
- Monitor how sales, proceeds, and refunds shift over time
- Break down performance by store, country, and timeframe
- Strengthen reports with reliable data and cleaner visuals
So whether you’re reviewing month-end performance or looking into a sudden drop, you’ll have the context to explain and the data to act.
What it shows
Once your app is integrated via App Store Connect or Google Play Console, Revenue Snapshot starts pulling your revenue data directly from the source. No manual entry, no second-guessing.
Here’s what you can control:
- App & country selection: Choose which app to analyze and which markets to monitor.
- Custom date ranges: View trends from any point within the past 12 months.
- Granularity settings: Switch between daily, weekly, or monthly views depending on your reporting needs.
Pro tip: Weekly granularity strikes the perfect balance when comparing countries or spotting mid-term fluctuations.
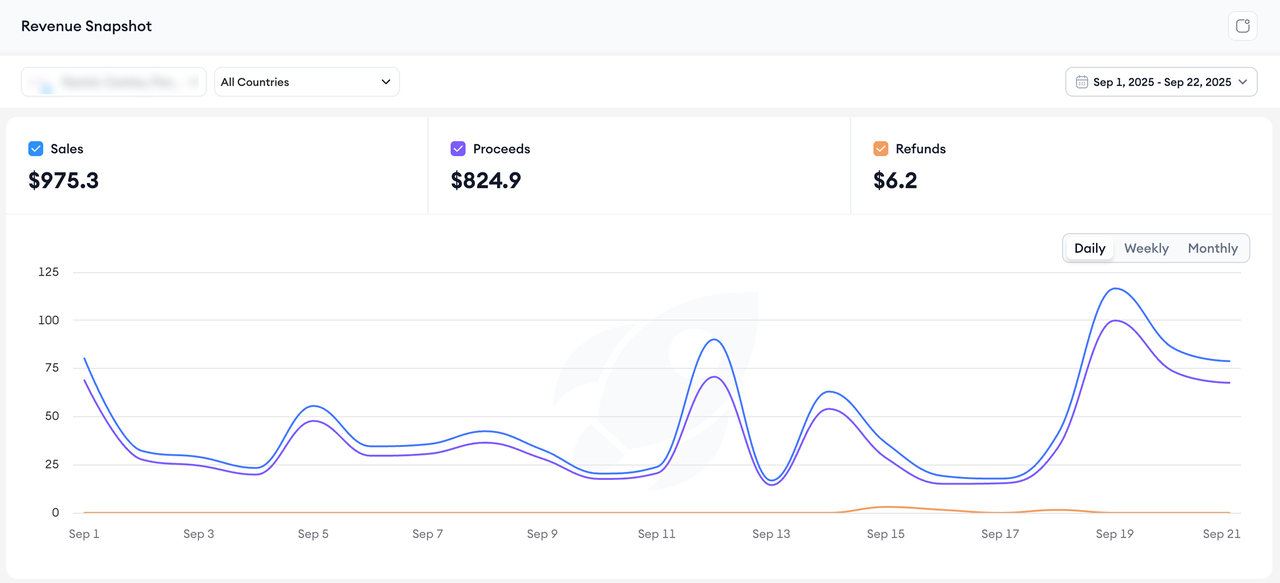
A clean chart shows how your revenue metrics are moving across time, markets, or product updates. Use it to identify growth patterns, refund surges, or seasonal dips. Need a focused view? Toggle off specific metrics in the legend to simplify what’s shown.
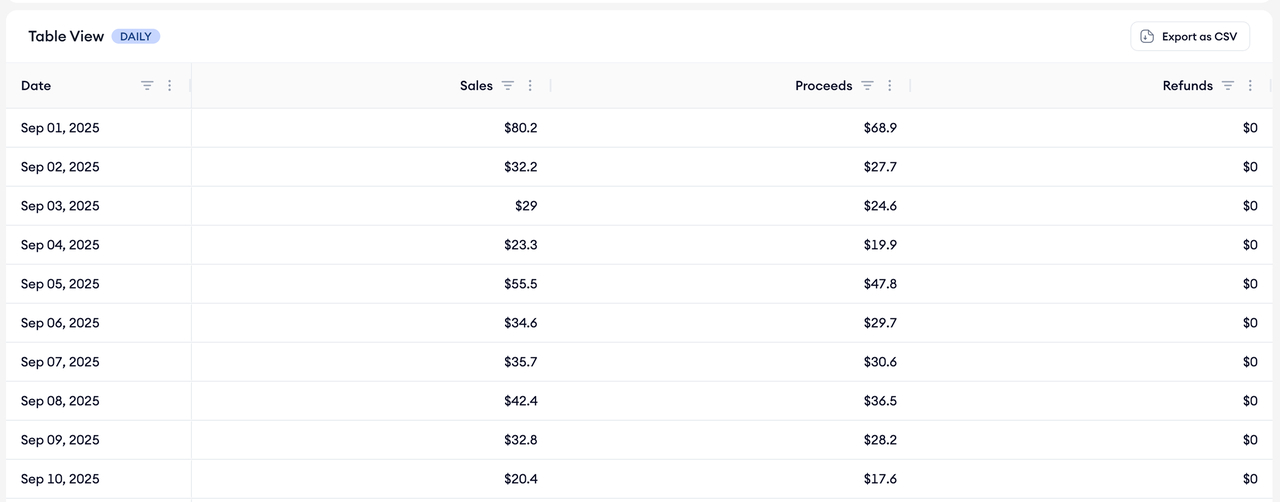
The table view gives you a breakdown of:
- Sales (App Store) or Revenue (Google Play Store)
- Proceeds (after store commission)
- Refunds
Each row aligns with your selected filters and granularity, so your report always reflects the exact context you’re analyzing.
Pro tip: Export your table to create structured reports for team syncs, investor decks, or internal benchmarks.
Bring clarity to your revenue performance
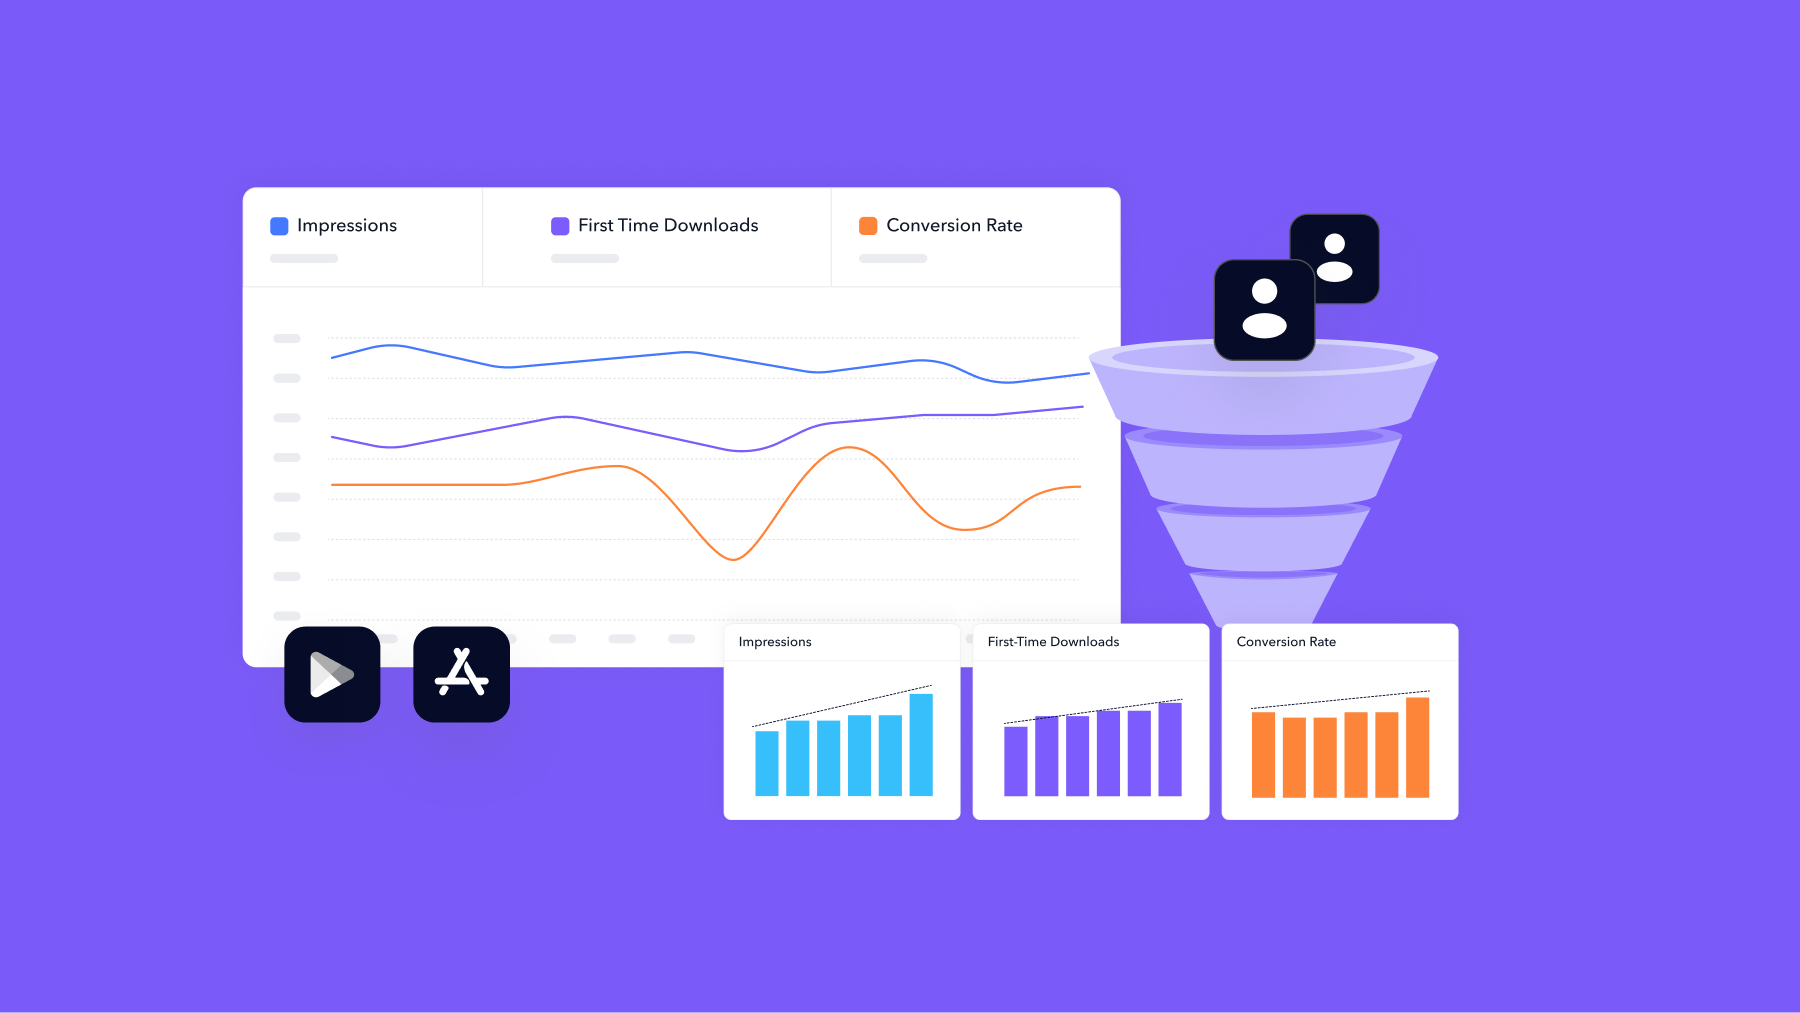
You already track impressions, taps, and installs; it’s time to apply the same clarity to your earnings.
With Revenue Snapshot, you get a focused, filterable view of your app’s financial performance. Spot patterns, explain outliers, and strengthen your reporting with trusted data behind every number.
Log in to the MobileAction platform and head to Revenue Snapshot to start exploring your revenue trends.
Need a hand getting started? Book a demo here.