


Looking to boost your app's visibility and acquire more users? Our 2025 ASO Report is your ultimate guide to navigating the evolving app store landscape. Packed with data-driven insights, keyword trends, and top-ranking app strategies, this report will equip you with the knowledge to optimize your app's presence and achieve organic growth.
Every app marketer has been there… Your installs suddenly spike or dip, and the big question comes up: why? Was it the new screenshots? A metadata tweak? Maybe something shifted in the market? Usually, figuring it out means digging through different reports and trying to piece everything together.
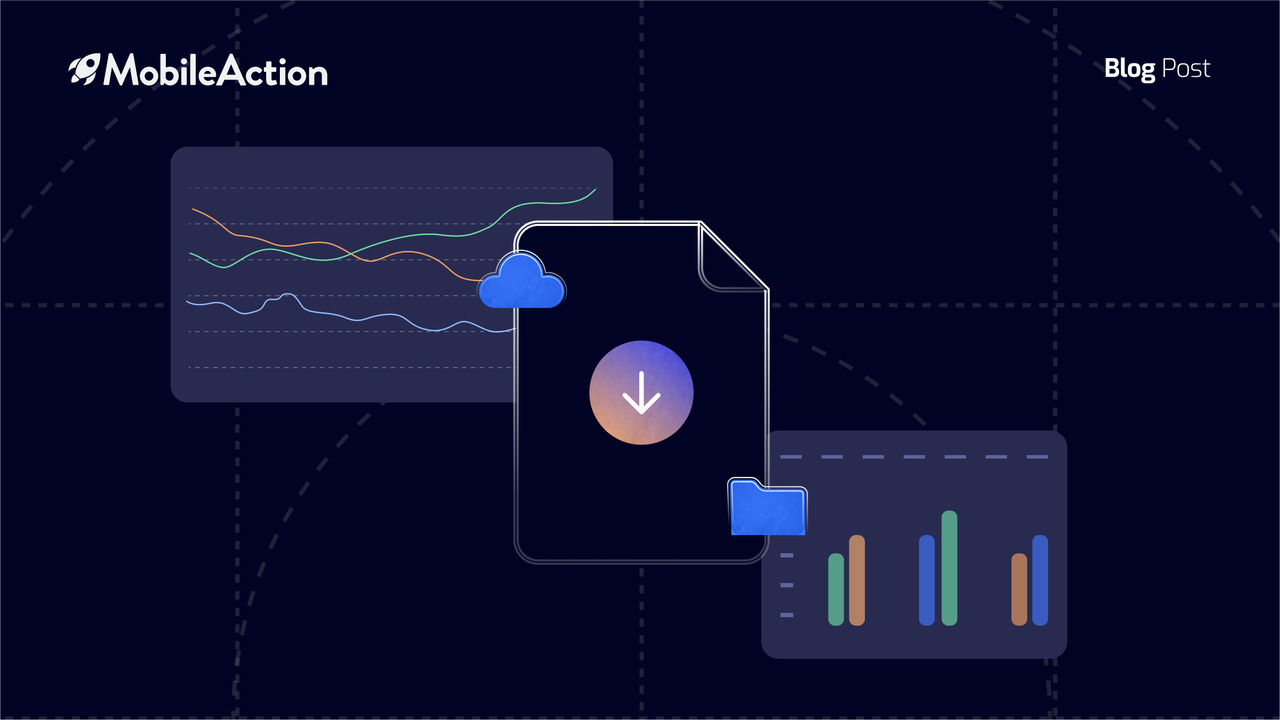
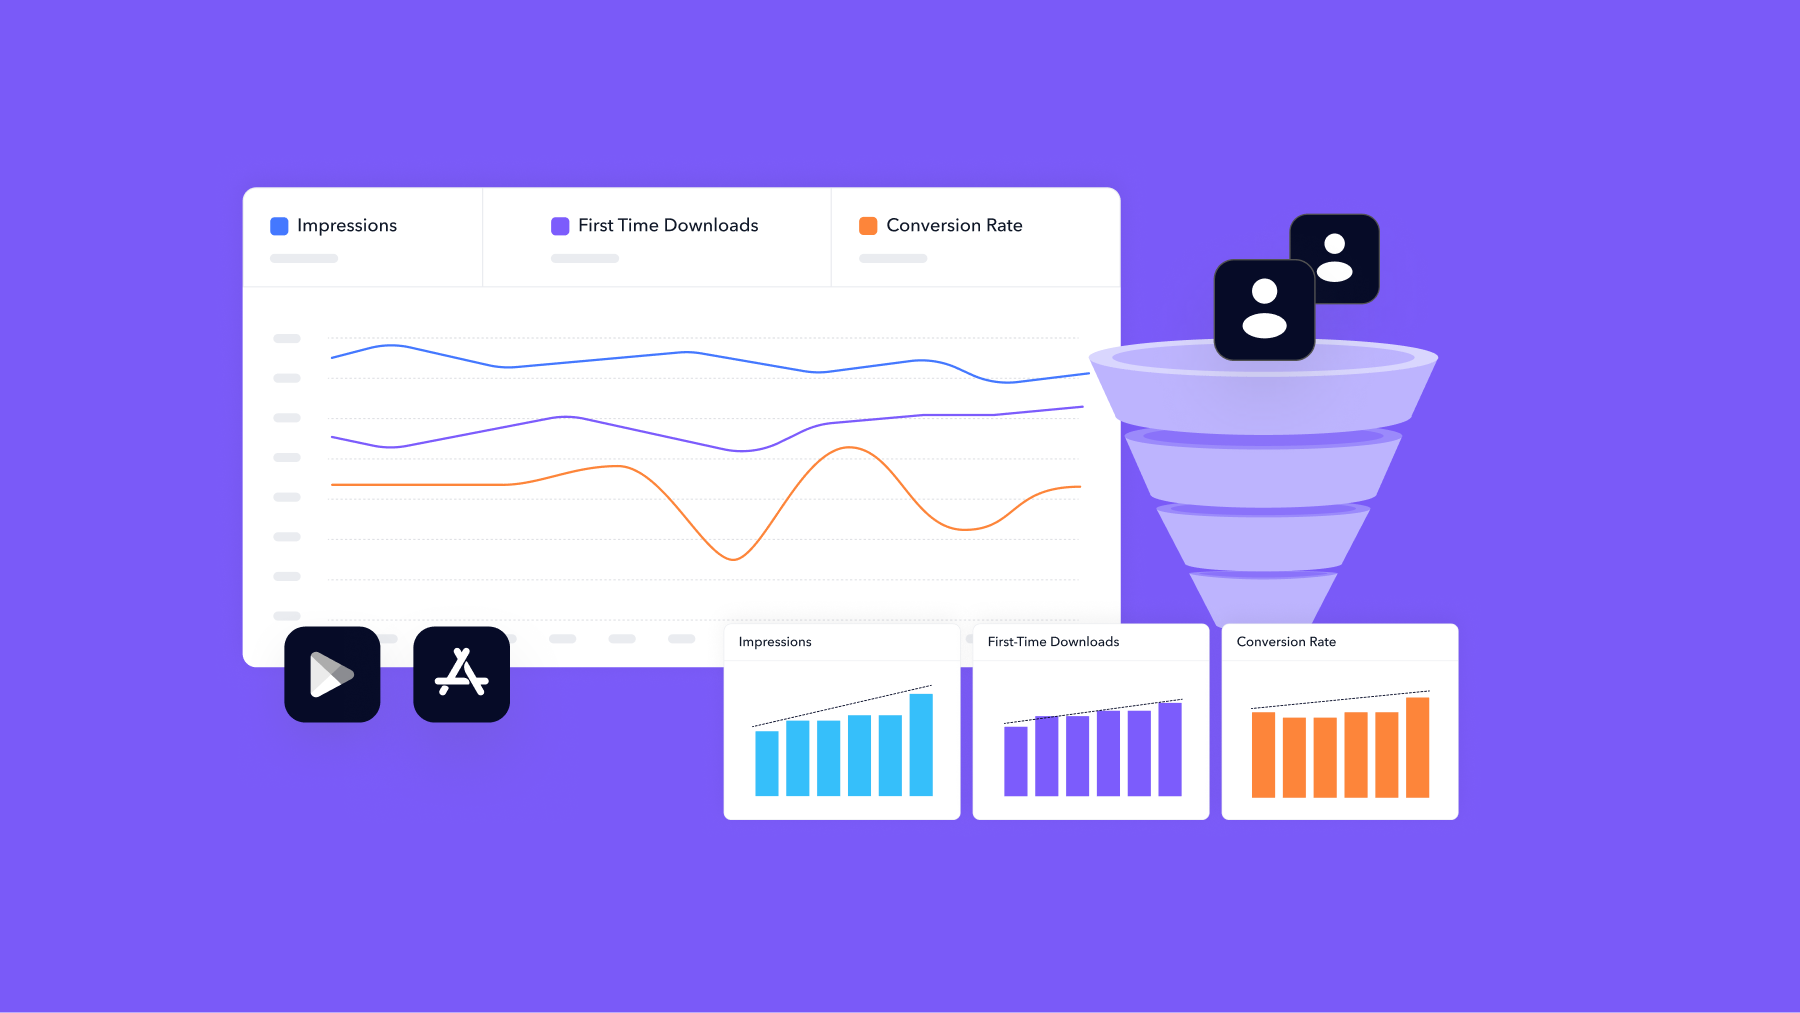
We’ve seen how tricky it can be to track down the real story behind your installs. That’s why we built the Conversion Funnel View: it puts impressions, first-time downloads, and conversion rates side by side, so you can finally see what’s going on.
Why we built it
One of the biggest frustrations we kept hearing from app marketers was simple: “I can see my installs going up or down, but I can’t tell what’s driving the change.”
To answer that, you’d usually need to check impressions in one report, downloads in another, calculate conversion rates yourself, and still piece everything together manually. That kind of back-and-forth takes time and often leaves you with more questions than answers.
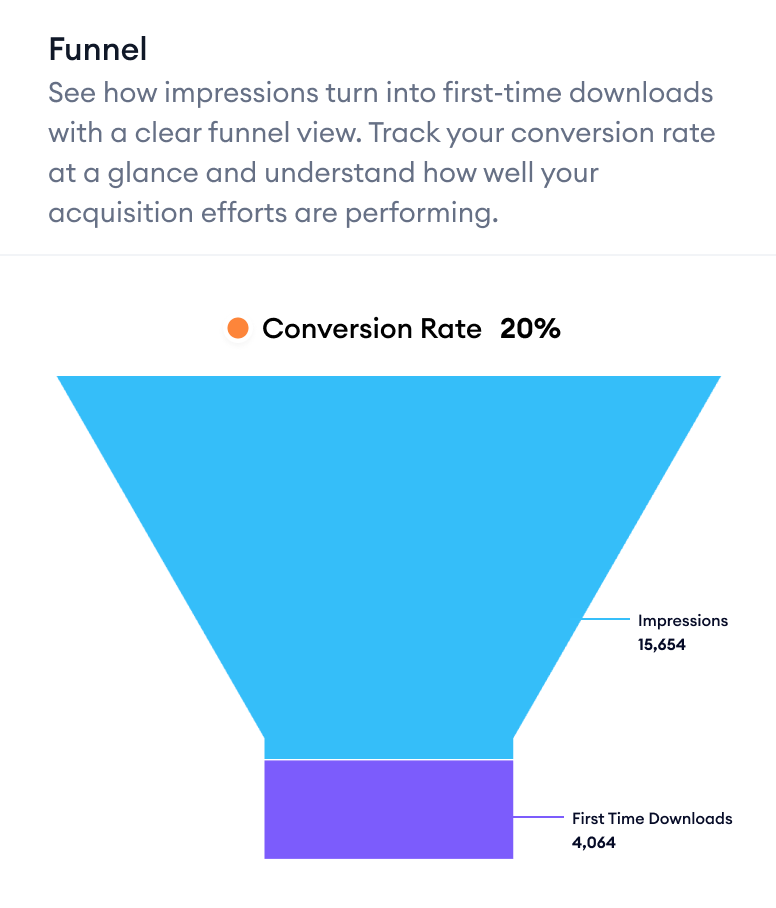
We built the Conversion Funnel View to remove that friction. Instead of scattered data, you get impressions, first-time downloads, and conversion rates all lined up. That means you can quickly see if a drop in installs comes from fewer people discovering your app, or if something on your product page made fewer of them convert.
It’s also about spotting the bigger picture. Maybe your installs look fine this week, but the six-month chart shows a slow decline in conversion rate. Or maybe a small bump in impressions actually marks the start of a sustained upward trend.
By putting these pieces together, the tool helps you move from reacting to single-day changes to understanding the full journey of your acquisition funnel.
What it shows
This dashboard pulls data directly from your App Store Connect and Google Play Console integrations and updates daily.
The Conversion Funnel View lays out the entire journey from impressions to installs in one place. Here’s what you’ll see when you open it:
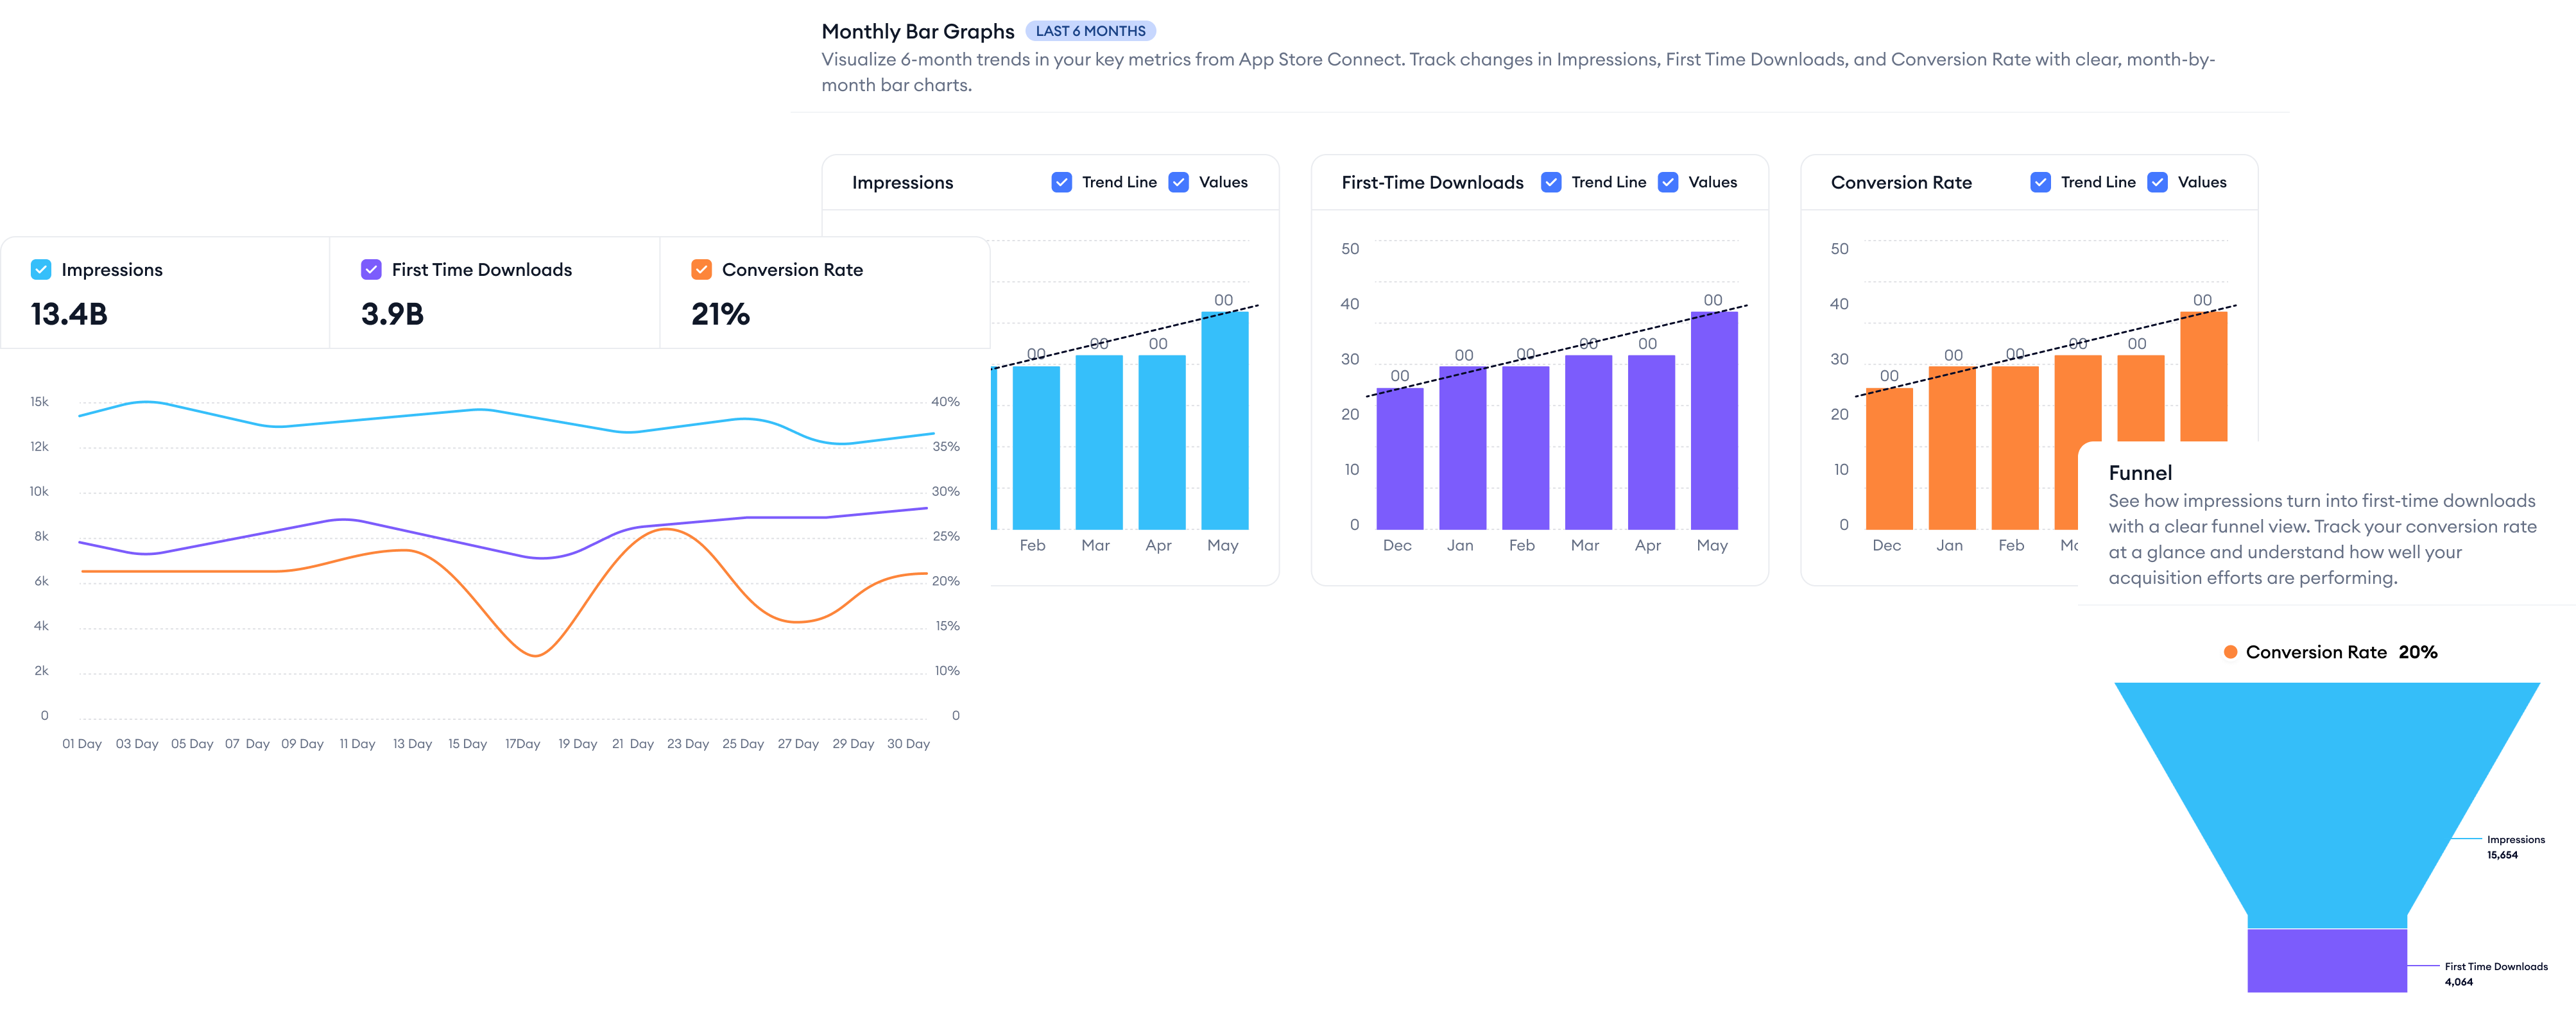
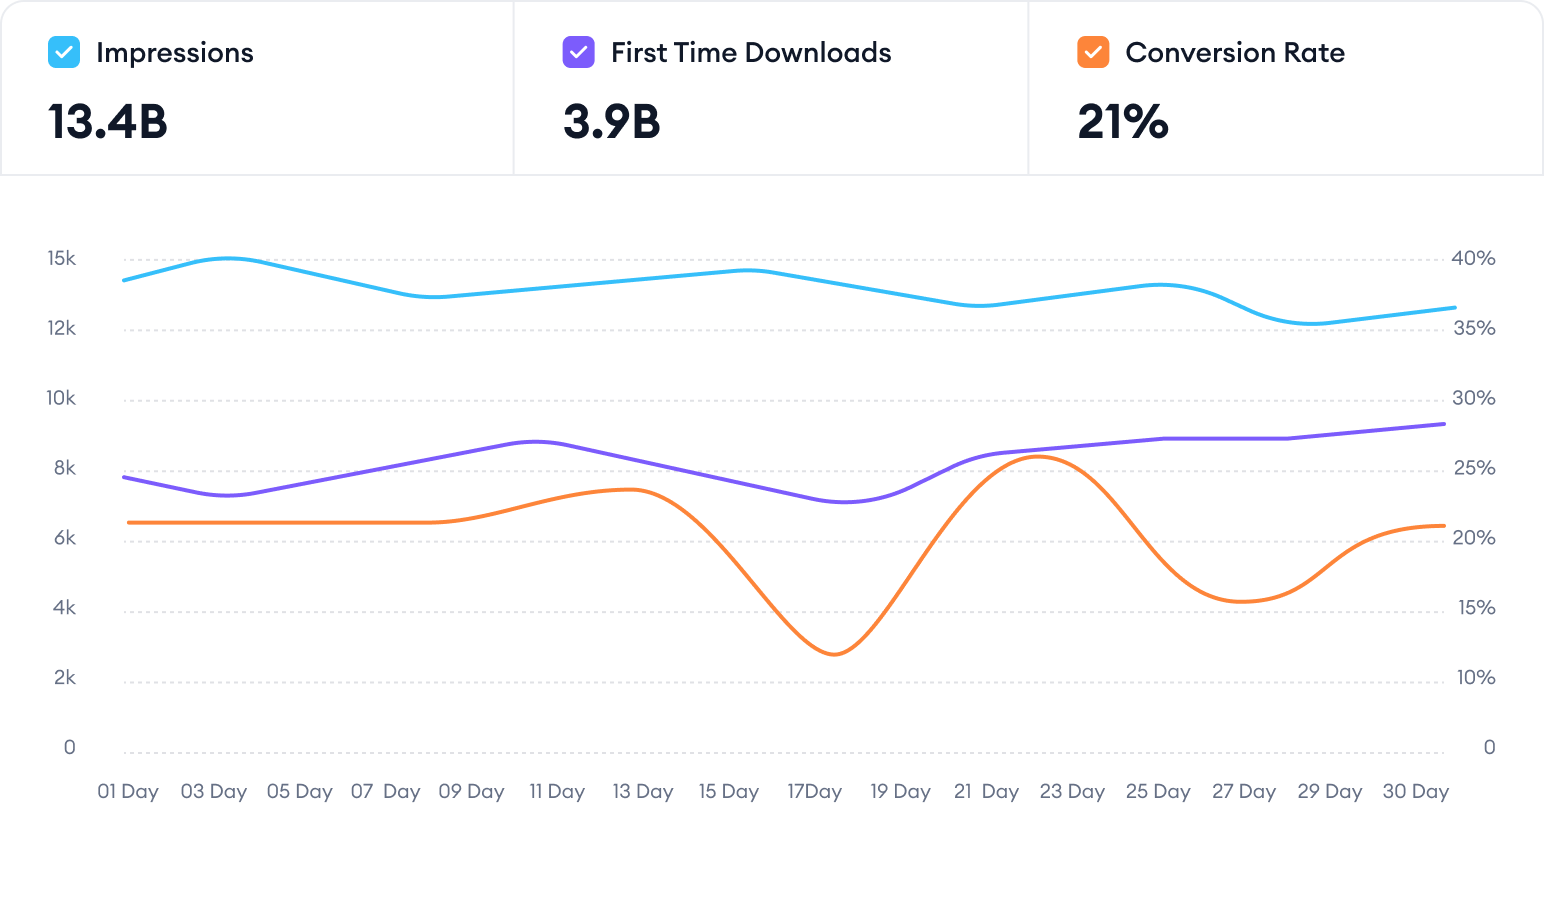
- Top summary: A snapshot of your total impressions, first-time downloads, and conversion rate for the period you select.
- Funnel graphic: A quick visual showing how many users move from seeing your ad to actually installing.
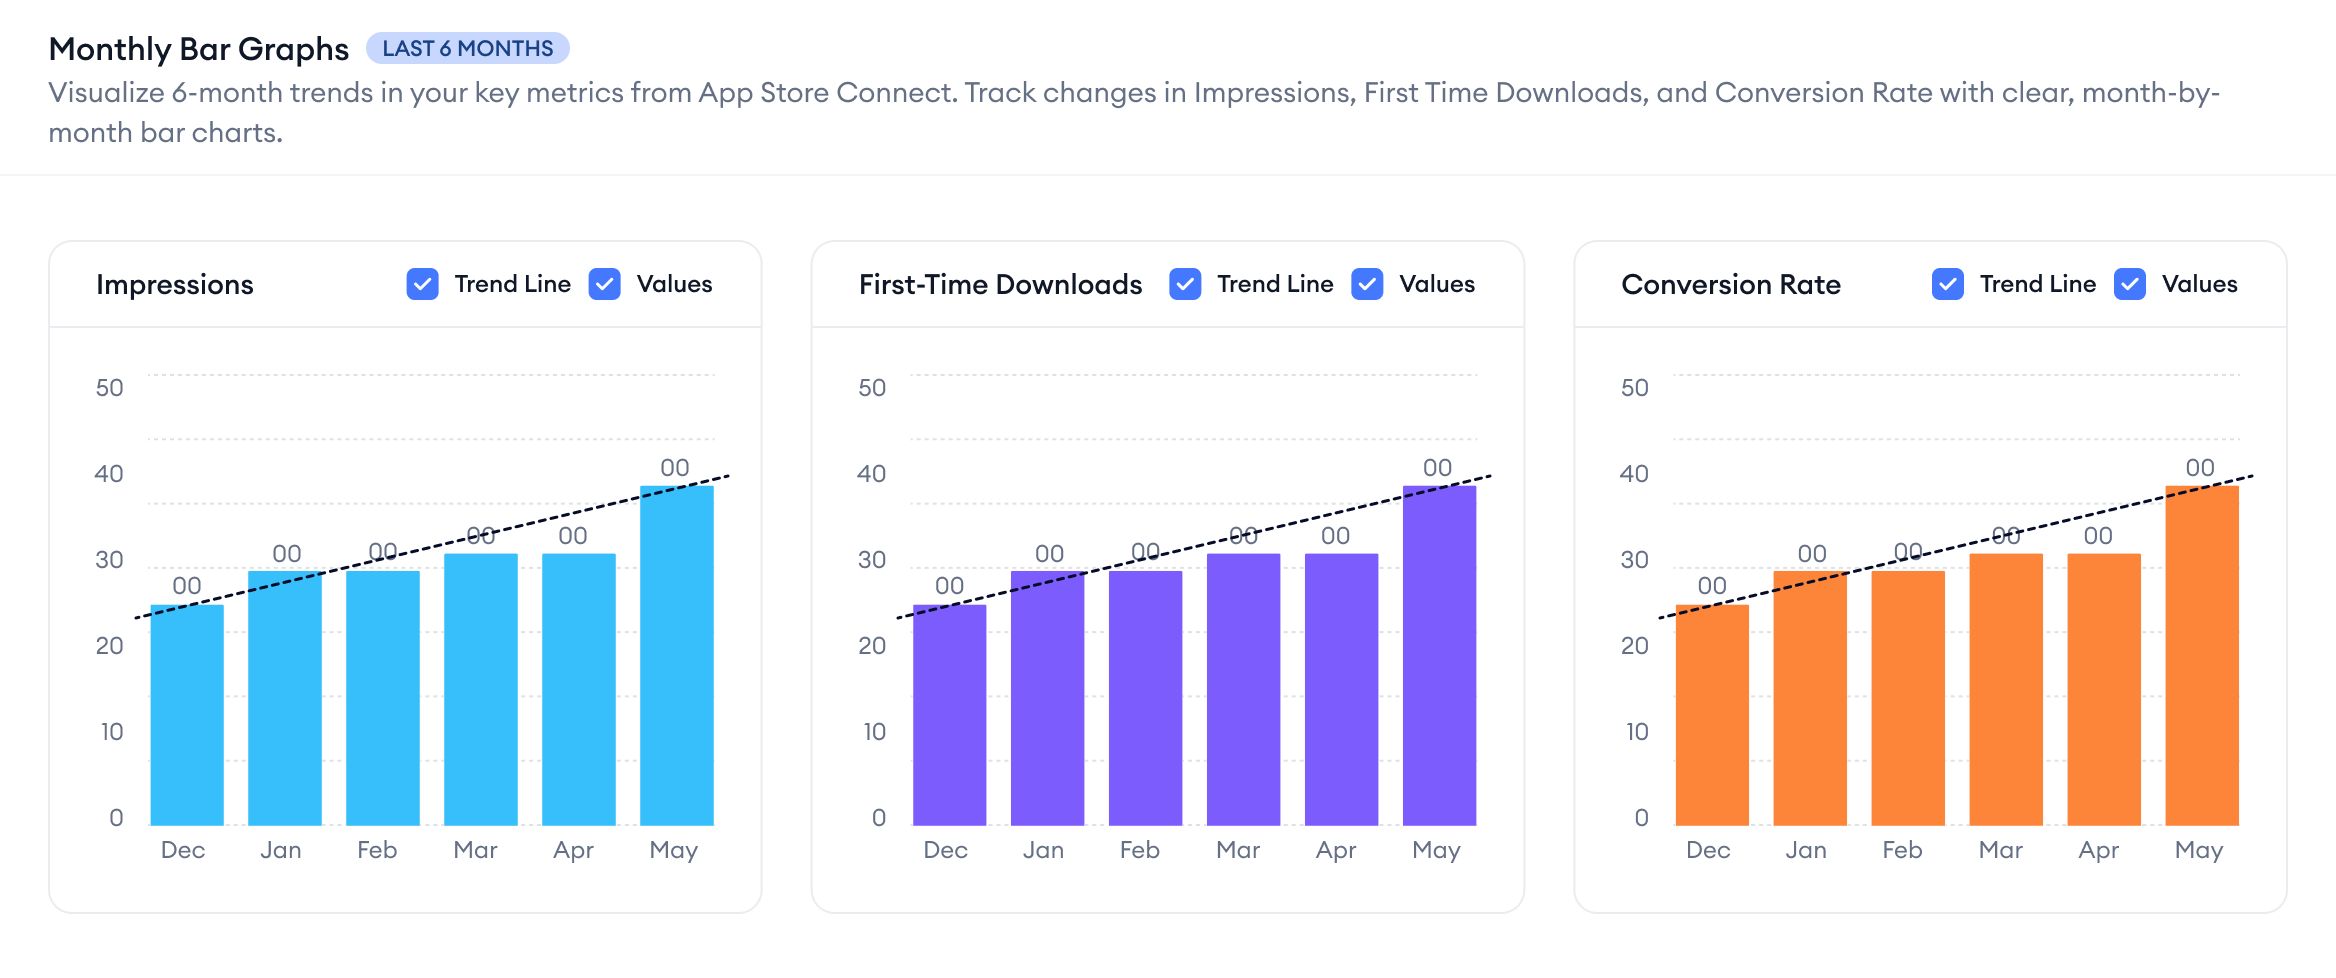
- Six-month breakdown: Side-by-side monthly bars for impressions, installs, and conversion rate, so you can spot steady improvements or declines that daily views might miss.
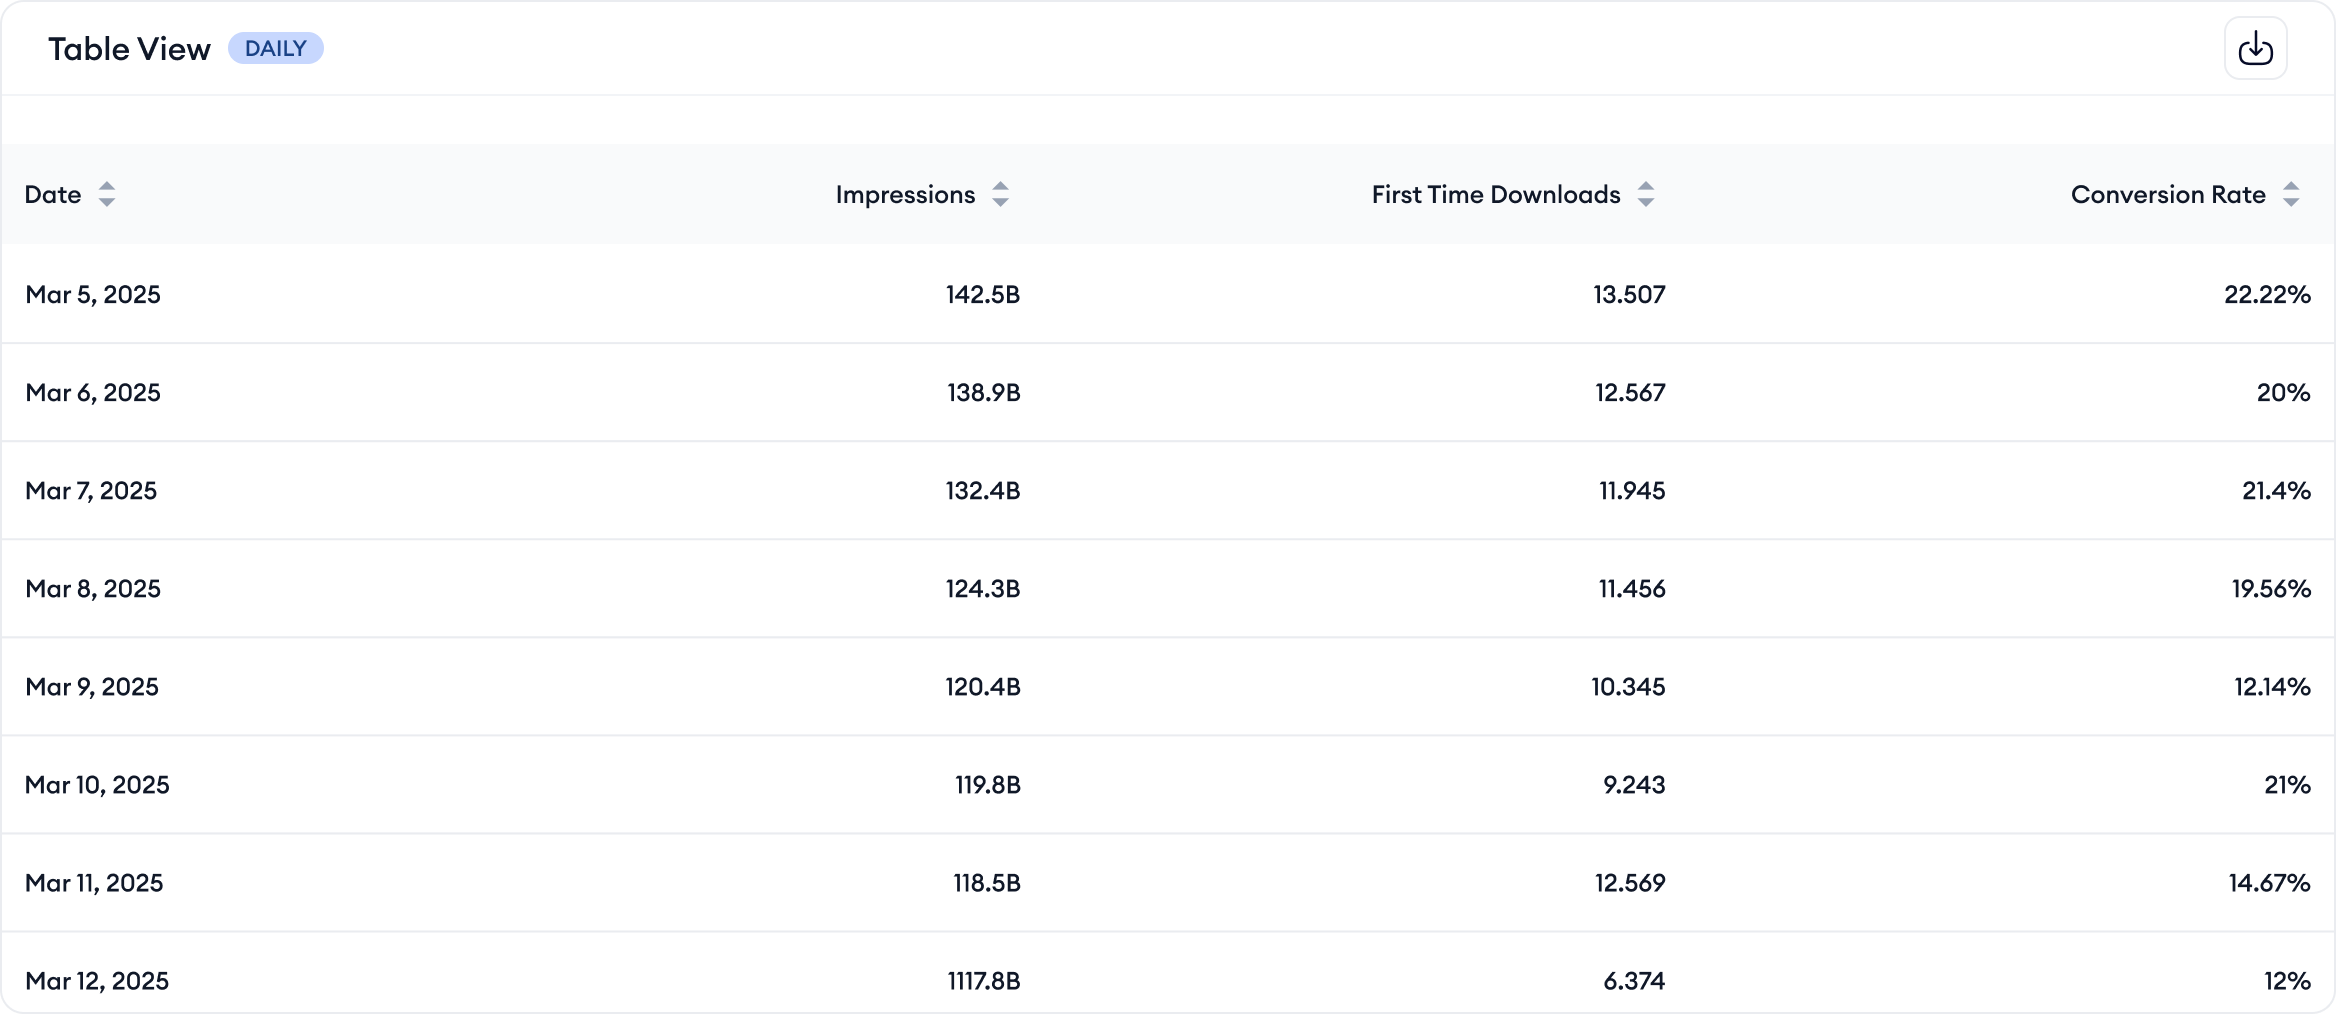
- Detailed table view: Daily metrics you can sort by impressions, installs, or conversion rate. Perfect for pinpointing exactly when a change started. Plus, you can export it all to CSV for reporting or deeper analysis.
Together, these views help you zoom out to see trends, then zoom in to catch the exact moments when performance shifted.
No more guesswork in your funnel
At the end of the day, the Conversion Funnel View is about clarity. Log in to MobileAction now and instead of chasing numbers across different reports, see the whole story of your installs. Whether you’re reporting back to your team, checking the impact of a new launch, or just trying to make sense of a sudden change, the funnel gives you the answers without the extra work.
Need a hand getting started? Reach out to us, and we’d be happy to walk you through it.