


Looking to boost your app's visibility and acquire more users? Our 2025 ASO Report is your ultimate guide to navigating the evolving app store landscape. Packed with data-driven insights, keyword trends, and top-ranking app strategies, this report will equip you with the knowledge to optimize your app's presence and achieve organic growth.
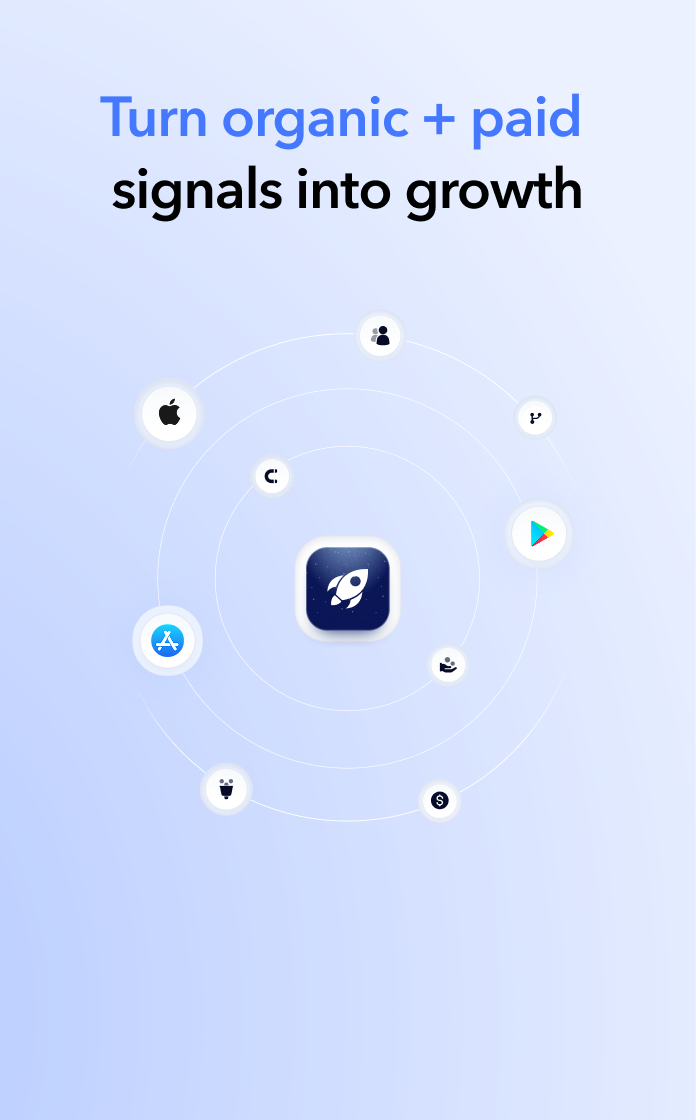
App growth doesn’t come from a single source, it’s the result of many moving parts.
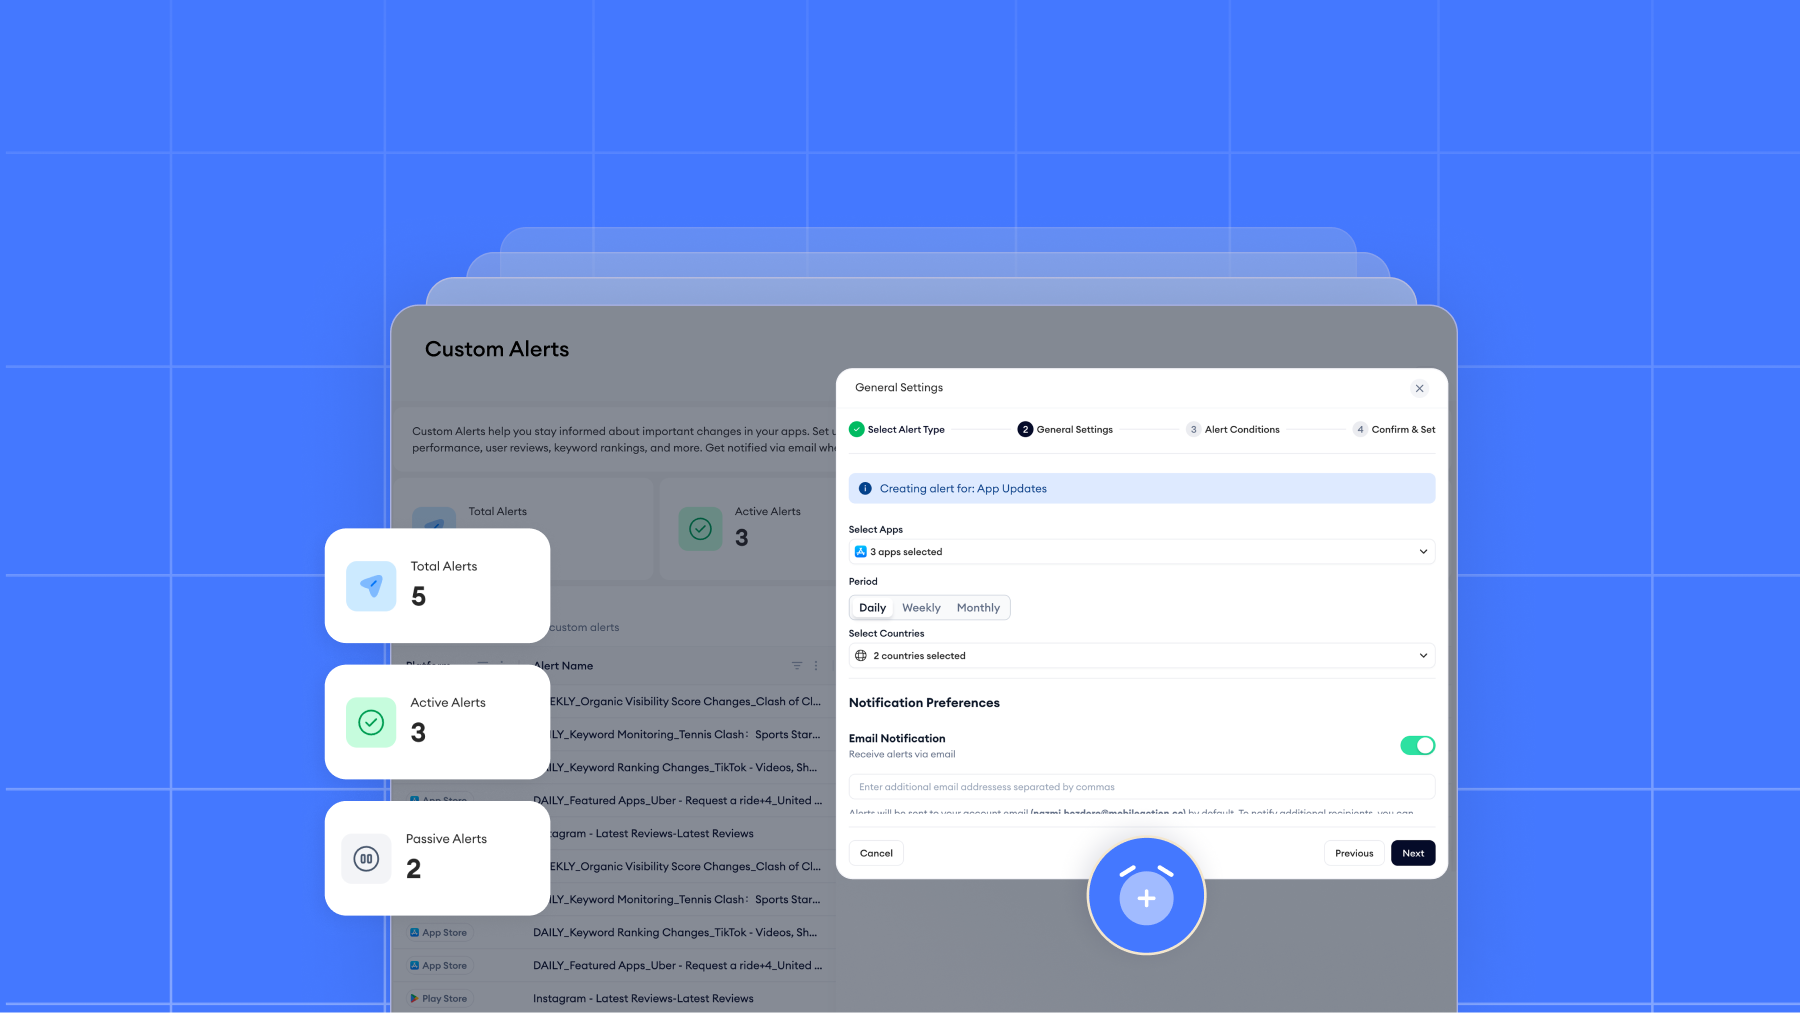
You track keywords, you monitor creatives, you monitor in-app activities and everything else going on around your app, across channels. But most of that data lives in different dashboards and making sense of it is so hard. With Store Analytics, you can now track how every campaign, keyword, and creative contributes to overall performance. All your data, finally speaking the same language.
The Store Analytics module combines data from Apple Ads, App Store Connect and Google Play Console, helping ASO and user acquisition teams understand not just what’s happening, but why it’s happening.
With the release of Analytics Overview, the final tool in the Store Analytics module, the full suite is now complete. This last piece ties everything together, giving you a unified view of how your visibility, conversion, and revenue metrics connect.
Why we built it
TL;DR: Because cleaner data leads to better decisions.
Longer version: Your downloads, rankings, and proceeds have always been linked but seeing those relationships clearly hasn’t been easy.
With Store Analytics, we set out to change that. By combining data from Apple Ads, App Store Connect, and Google Play Console, we created a single environment for analyzing how every part of your app’s growth connects.
It’s built for anyone who’s ever asked: How is my app performing, really?
Whether you’re evaluating campaign results, reviewing organic traction, or preparing reports, Store Analytics gives you one clear view of what’s driving your results and where you can take action next.
See how every metric fits together
The Store Analytics module currently includes five main tools, each designed to cover a different layer of your app’s performance. Together, they form a complete loop, from visibility to conversion to monetization.
Let’s take a look at how these tools work hand in hand.
1. Analytics Overview
We start with the big picture.
Analytics Overview gives a unified dashboard to see your app’s key performance metrics. It combines data from App Store Connect, Google Play Console, and Apple Ads, so you can see how organic and paid efforts work together.
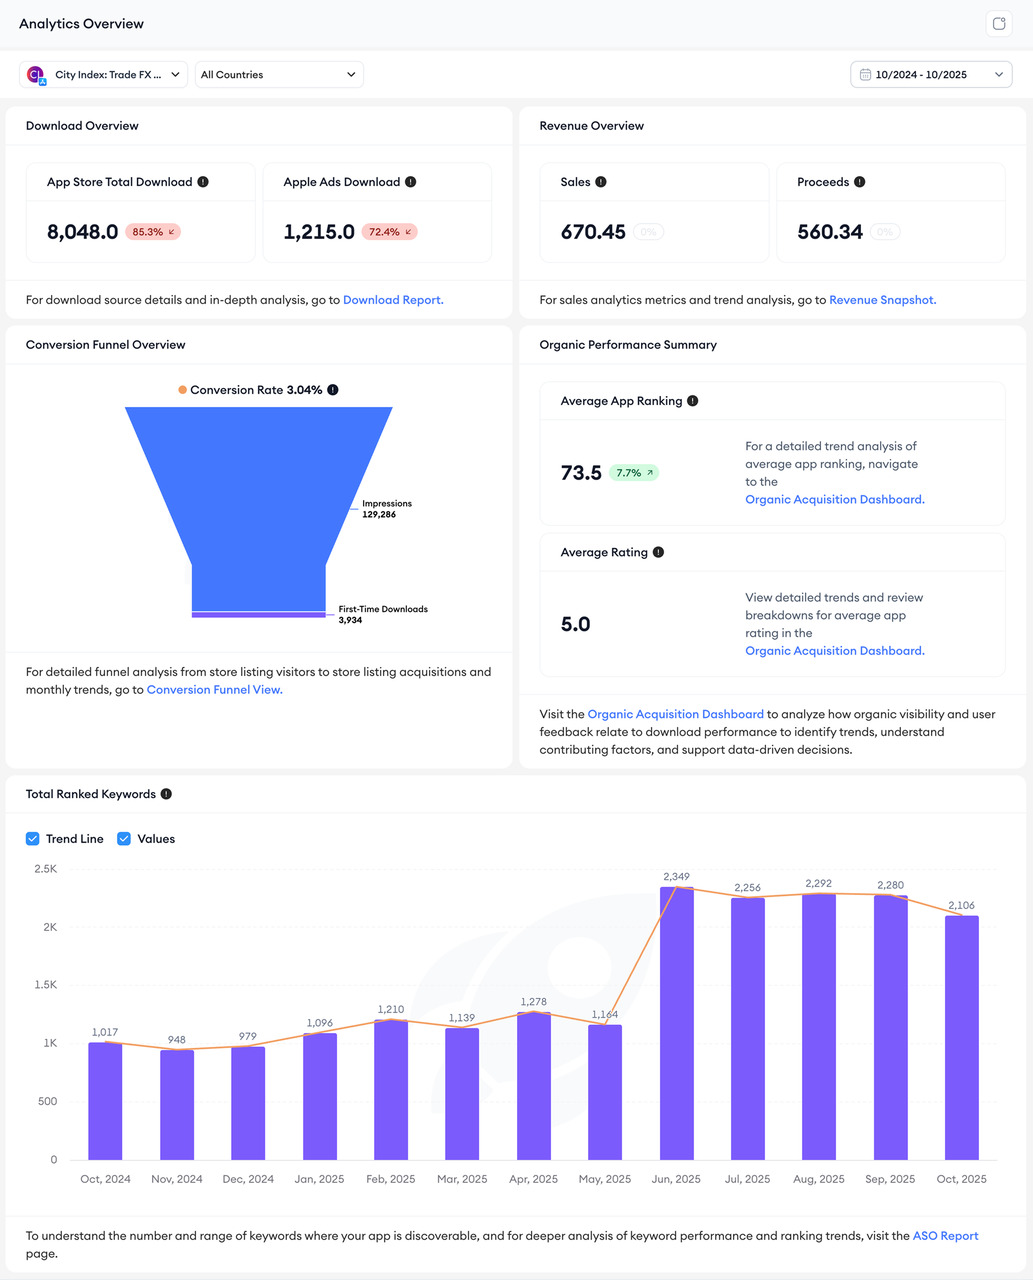
You can monitor:
- App Store Total Downloads and Google Play Store Total Downloads
- Apple Ads Downloads (for paid installs)
- Sales (Revenue) and Proceeds data
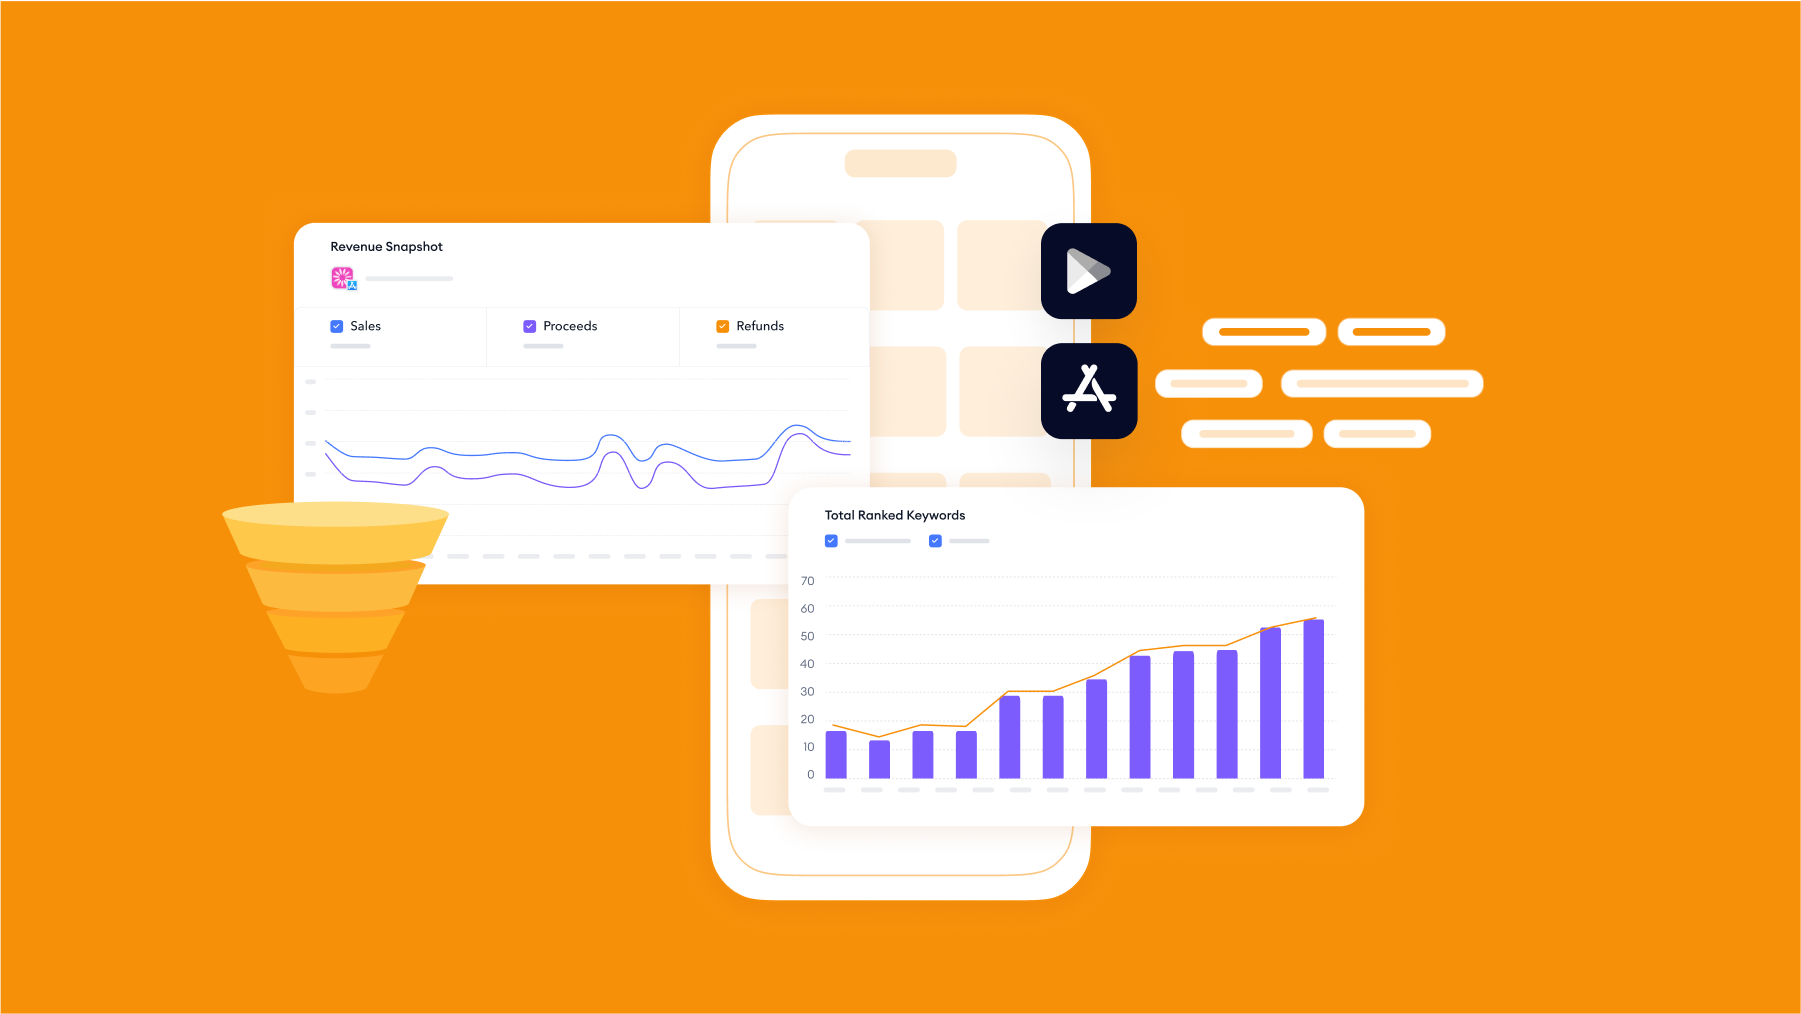
- Average App Ranking, Average Rating, and Total Ranked Keywords
It’s the fastest way to understand how your app is performing across stores, and how visibility turns into results. It’s also the main page that redirects you to the rest of the tools, where you can take a closer look and deep dive into every layer of your app’s performance.
2. Download Report
As the name suggests, it gives you everything you need to know about your downloads.
Download Report gives insights into your download sources and trends, breaking down where your installs come from and how they change over time.
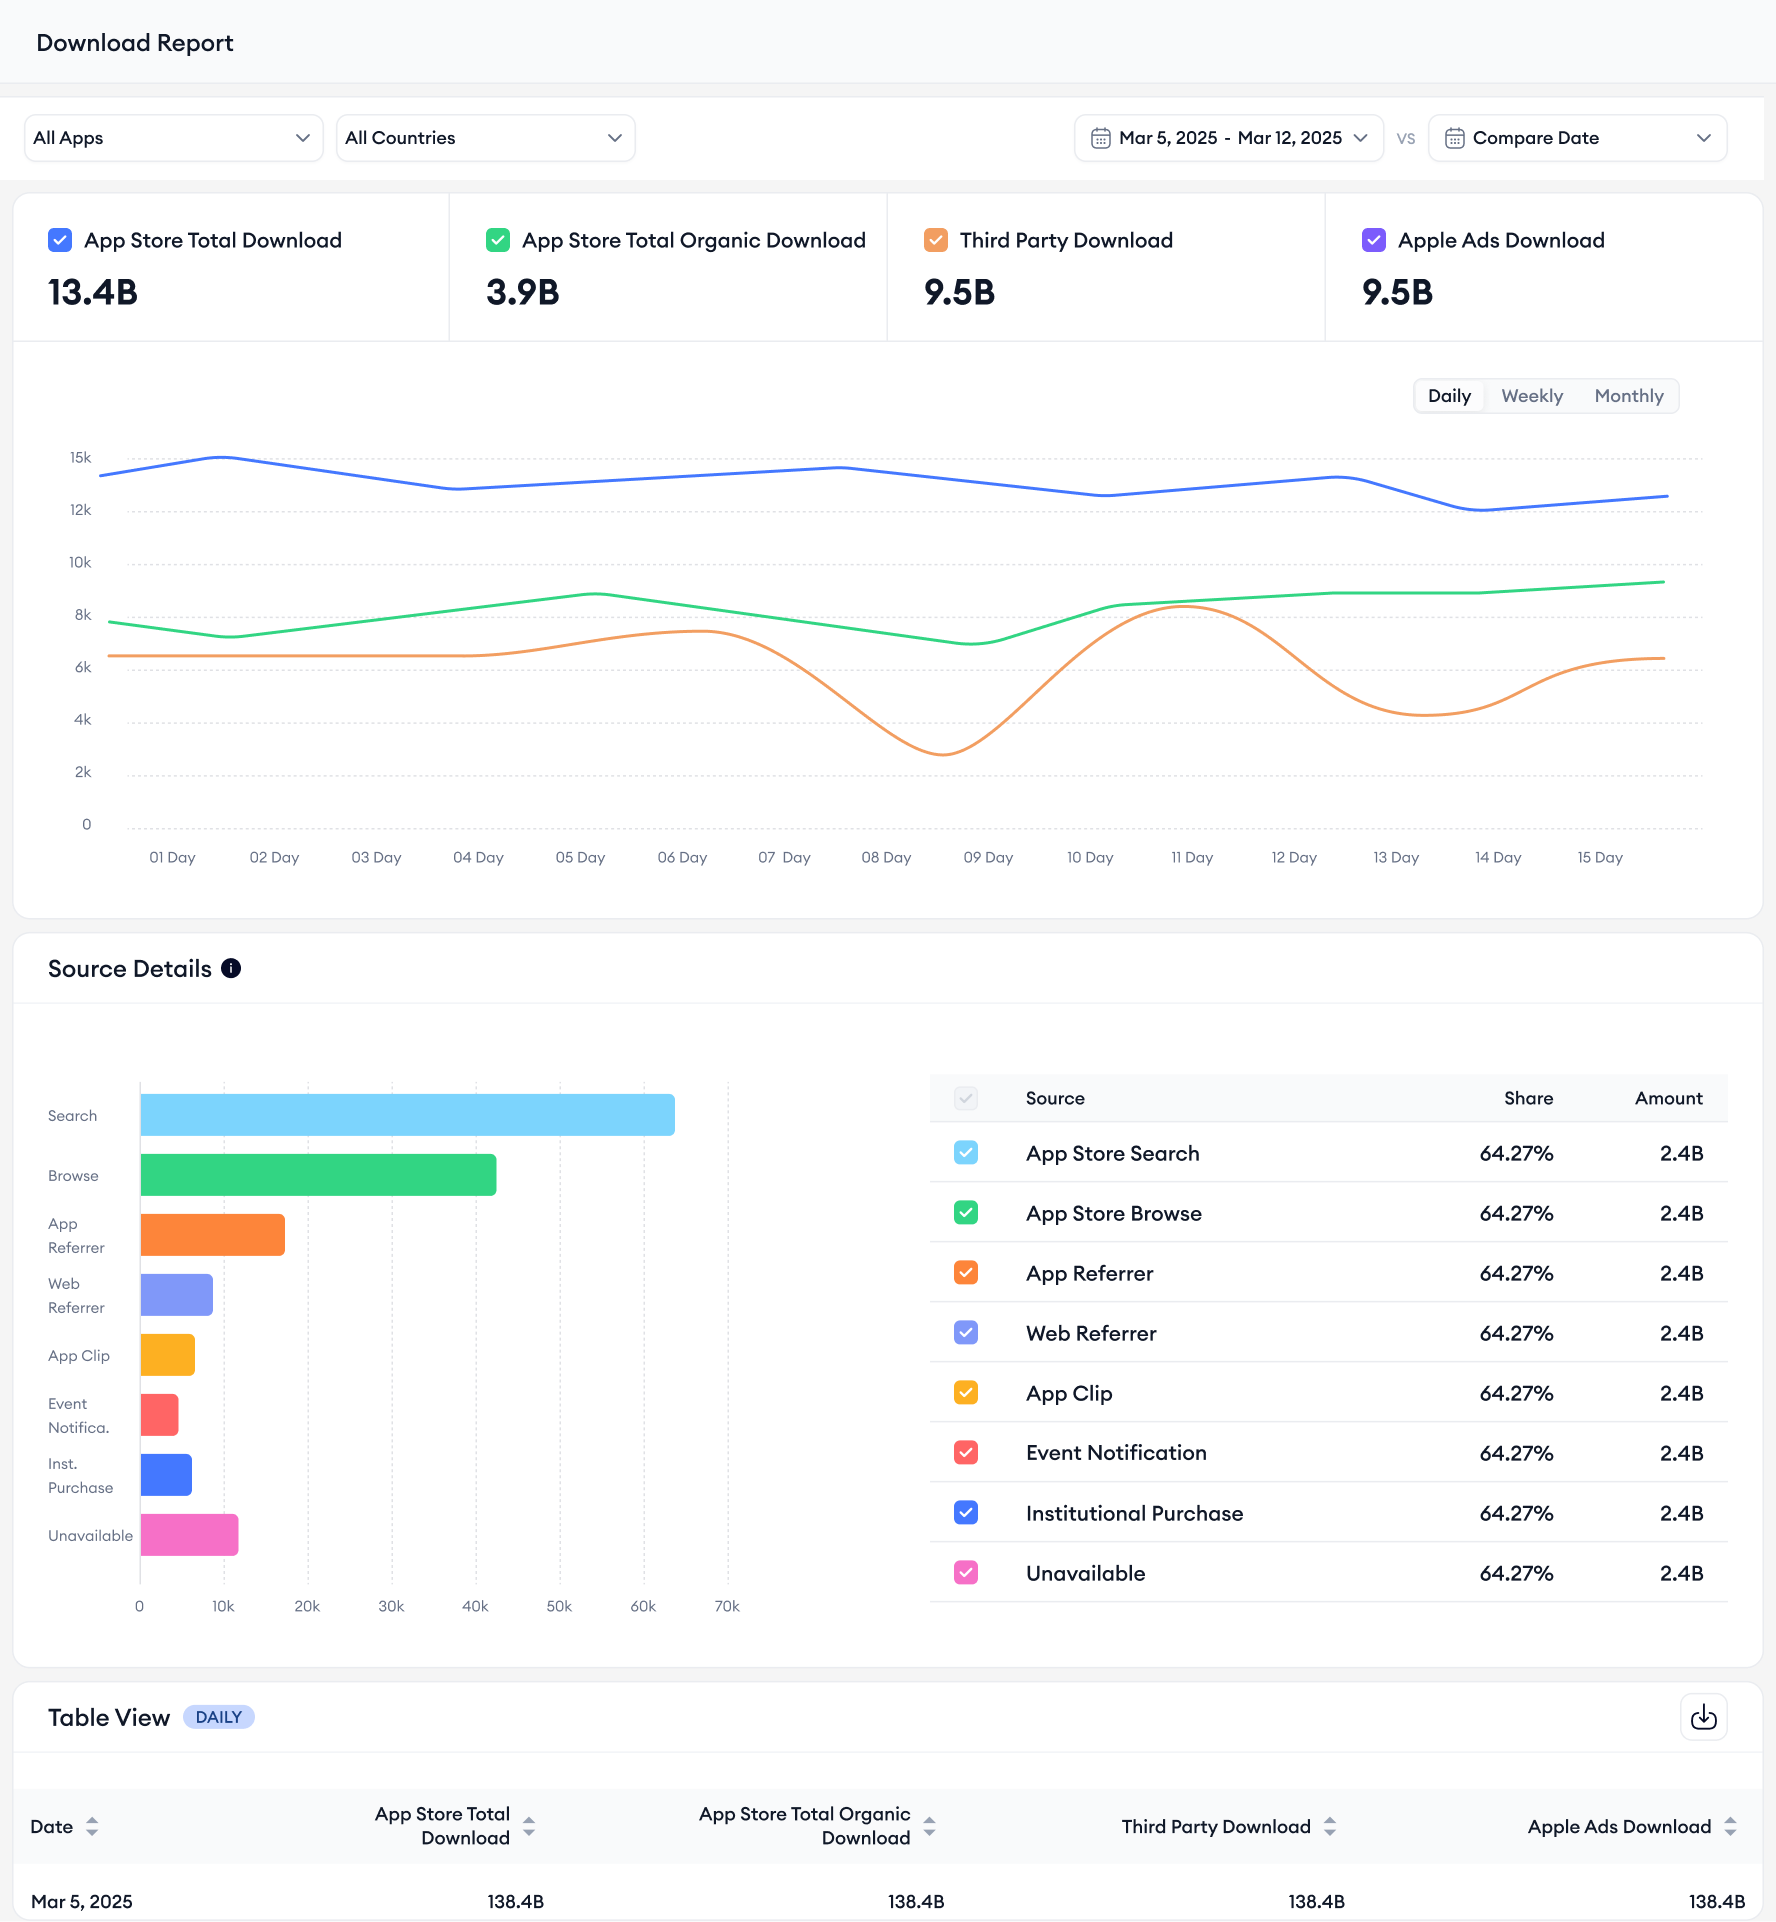
You can filter by country, app and time to see which markets and channels drive the strongest results. It’s a must-have tool for teams who want to measure paid and organic app performance at a granular level.
3. Revenue Snapshot
Once you’ve seen the full picture, it’s time to zoom in on earnings.
Revenue Snapshot lets you monitor proceeds, refunds, and sales trends across your connected stores. It’s built for teams that need to back decisions with real revenue data, whether it’s for performance reporting, forecasting, or budget planning.
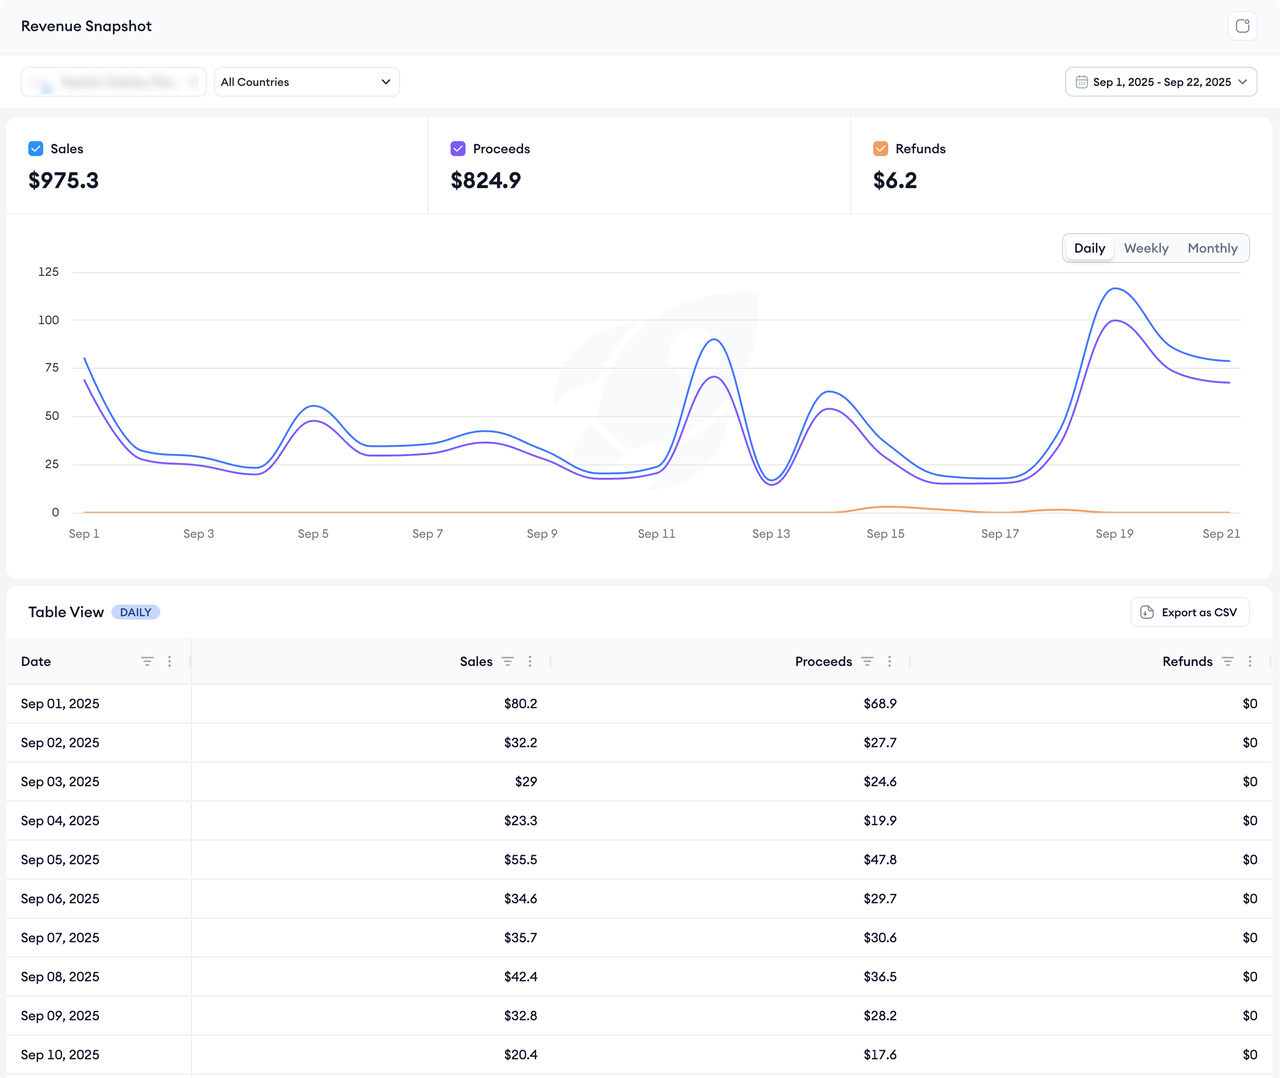
You can view trends by country and date and export clean, ready-to-share table and charts for your internal reporting.
4. Organic Acquisition Dashboard
Here you can find everything about your app’s organic visibility.
The Organic Acquisition Dashboard helps you track organic downloads, keyword-level visibility, and performance by country. It’s where ASO meets performance analysis, showing you how your store presence contributes to installs and rankings over time.
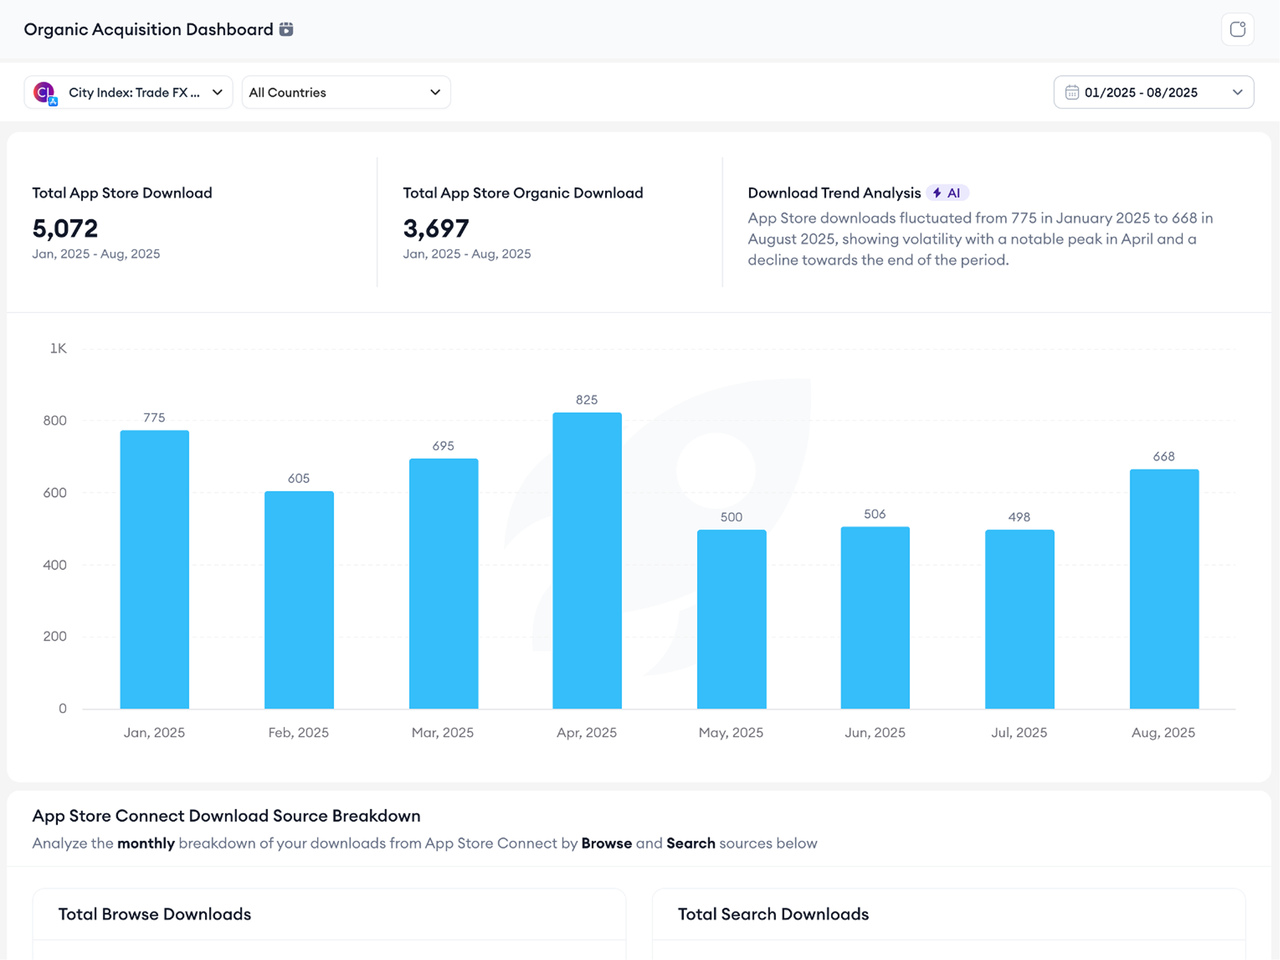
Combine this tool with your data from Download Report, and you’ll see how organic strength complements your paid campaigns.
5. Conversion Funnel View
Every download starts with visibility, but understanding how users convert is what turns insights into strategy.
Conversion Funnel View tracks how people move through your store presence, from impressions to installs.
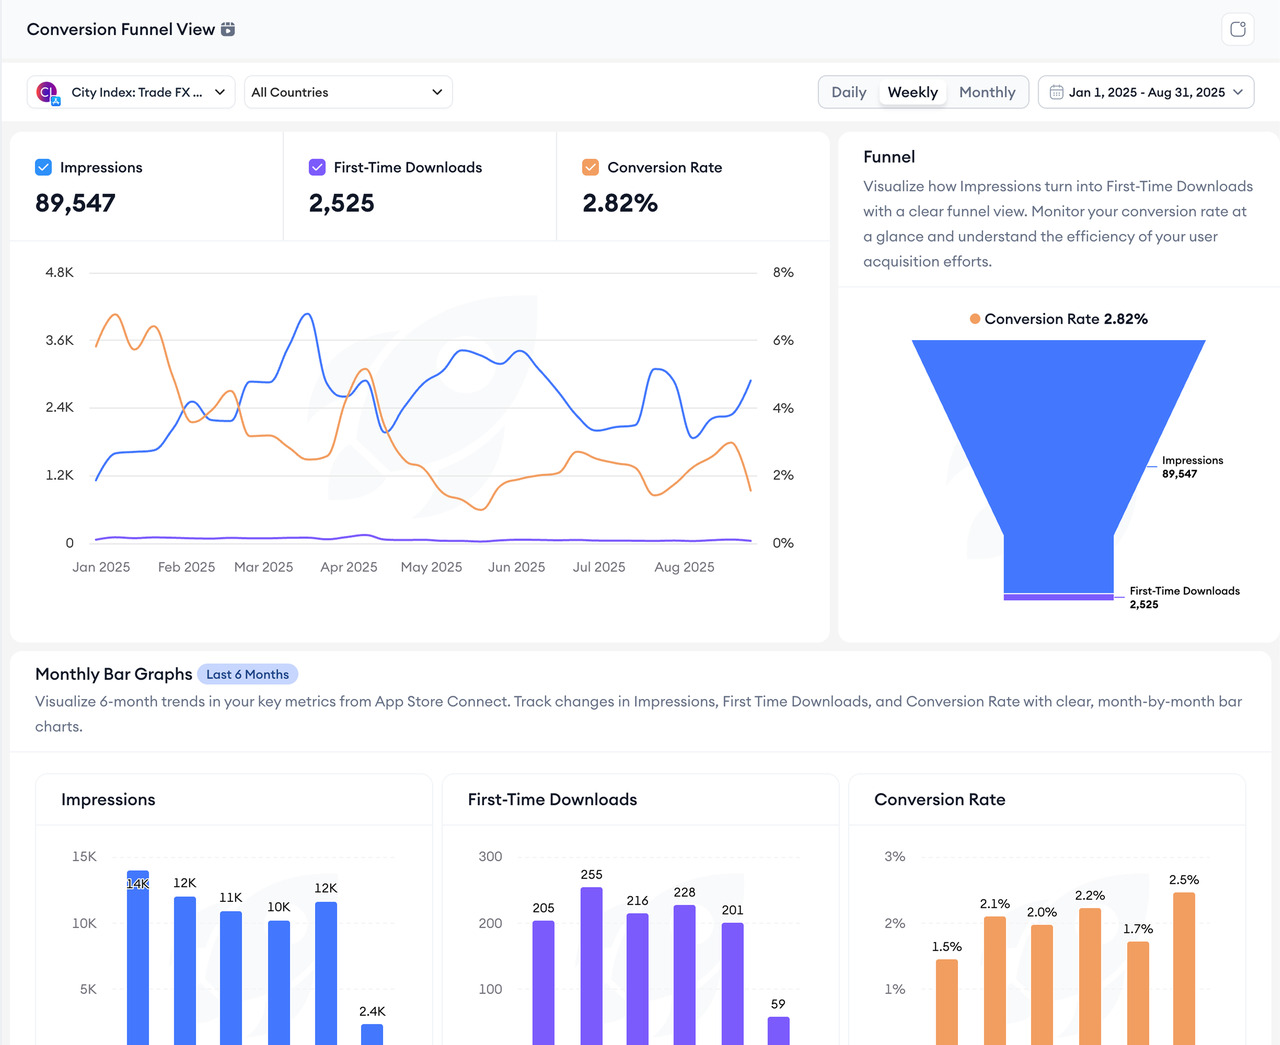
It helps you find how much of your impressions turn into first-time downloads. With both App Store and Google Play Store data, you can compare how successfully each store drives conversions.
Ready to make sense of it all?
With the release of Analytics Overview, the Store Analytics module is now complete, connecting visibility, conversion, and revenue. It’s built to help app marketers and growth teams make confident, data-backed decisions without the guesswork.
If you’re ready to understand what drives your downloads, how your rankings evolve, and where your growth opportunities lie, it’s time to explore the full ASO Intelligence suite.
Start your 7-day free trial of ASO Intelligence and see how every metric connects from keyword visibility to real revenue performance.