


App store optimization (ASO) is the practice of improving an app’s visibility in app marketplaces so more users discover and install it.
Like search‑engine optimization (SEO) for websites, ASO relies on data: you can’t improve what you don’t measure.
ASO KPIs (key performance indicators) are the metrics that tell you whether your optimization efforts are working.
By tracking these indicators, you can understand how your app performs at every stage of the user journey and adjust your strategy accordingly.
Why ASO KPIs matter
Mobile apps compete in crowded marketplaces; Apple’s App Store and Google Play host millions of apps.
Simply publishing an app isn’t enough—data from downloads, traffic sources and user behaviour must be measured and analysed to inform optimization decisions.
Without tracking KPIs, you risk wasting budget on activities that don’t move the needle. Consistent measurement allows you to:
- Evaluate how visible your app is in search results and top charts.
- Identify which creatives or keywords drive users to install your app. A/B testing helps pinpoint the winning elements.
- Compare performance against competitors and industry benchmarks.
- Detect early signs of churn or negative sentiment so you can respond quickly.
- Connect marketing spend to revenue by monitoring organic uplift, lifetime value and average revenue per user.
Categories of ASO KPIs
Experts typically group ASO KPIs into five categories: visibility, conversion, growth, user feedback and monetisation. Each category covers multiple metrics that capture different stages of the funnel.
Visibility metrics
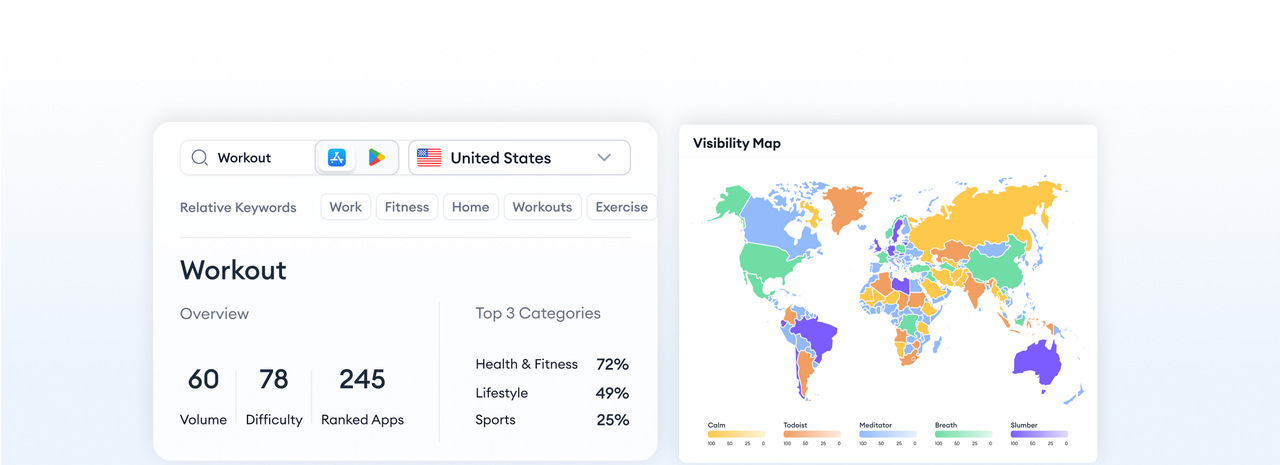
The first hurdle is getting potential users to see your app in the store. Visibility metrics measure how easily your app can be discovered through search, browse and featured placements.
| Metric | What it measures | Notes |
| Keyword rankings | Your app’s position for target keywords in App Store/Google Play search results. | Rank for high‑volume, relevant keywords to maximise discoverability. |
| Top‑chart and category rankings | Position in top charts (free, paid or gross) and within the app’s category. | Higher rankings bring more browse impressions and credibility. |
| Impressions/Store‑listing visitors | In the App Store, impressions count how often your app is viewed in Today, Games, Apps or Search tabs. Google Play instead reports store‑listing visitors—the number of users who viewed your listing. | Track both to gauge overall visibility; spikes often occur when an app is featured. |
| Visibility score | Composite metric combining the number of keywords you rank for, their search volumes and your ranking positions. | Useful for comparing visibility against competitors. |
| Featured listings & similar apps | Number of times your app is featured by the store or appears in the “similar apps” section. | Being featured boosts impressions but may lower conversion rate because many users browse out of curiosity. |
Tip: Regularly monitor keyword rankings and visibility scores and update metadata to target high‑volume search terms. Use A/B tests to optimise titles, subtitles and keywords.
Conversion metrics
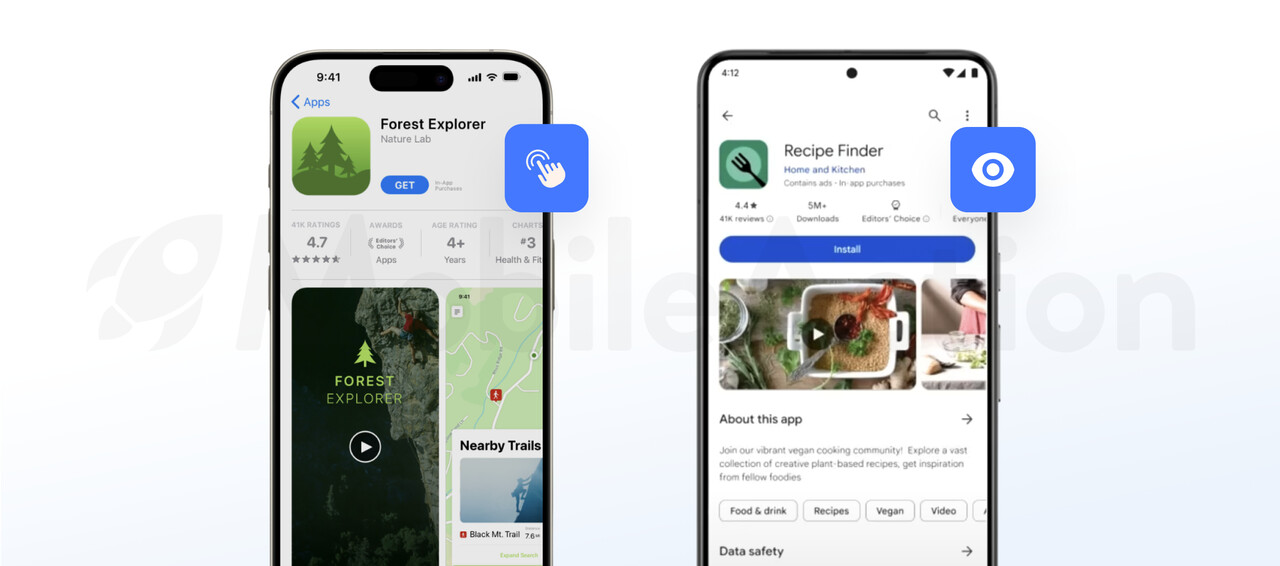
Getting users to a product page is only the start; you need them to download and install your app. Conversion KPIs assess how effective your store listing is at convincing visitors to act.
| Metric | Definition | Implications |
| Click‑through rate (CTR) | Percentage of users who see your app in search results and tap through to the product page. | Low CTR may indicate that your app icon, title or rating doesn’t stand out. |
| Conversion rate (CR)/Install rate | Percentage of users who visit your product page and then install your app. | Apple calls this “Install Rate,” while Google Play calls it “Store listing conversion rate”; segment by traffic source to see which channels convert best. |
| Impressions → product page CTR (App Store) | Ratio of impressions to product‑page views. | Measures how well your screenshots and preview video entice users to learn more. |
| Product page → install CR (App Store) | Percentage of product‑page views that result in downloads. | Focus on creatives and messaging here; use A/B tests to improve screenshots and video. |
| Google Play store‑listing conversion rate | Percentage of store‑listing visitors who install your app. | Compare your CR to peers in Google Play Console to gauge competitiveness. |
Improving conversion metrics often requires optimising on‑metadata (icon, title, description, screenshots and video) and off‑metadata factors such as download count and user ratings. A/B testing different creatives, conducting keyword research and highlighting unique value propositions can dramatically raise conversion rates.
Growth metrics

Visibility and conversion produce downloads, but growth KPIs tell you if these numbers are increasing over time and whether paid campaigns are delivering sustainable results.
| Metric | Why it matters |
| Number and velocity of installs | Basic indicator of acquisition; track installs and the pace at which they grow to understand momentum. |
| Monthly and Daily Active Users (MAU/DAU) | Active users show whether your app retains users; rising MAU/DAU indicates sustainable growth. |
| Organic vs. paid installs | Organic users (search/browse) are usually more engaged and cost‑effective than paid users. Distinguish organic uplift from paid campaigns by comparing periods with and without advertising. |
| Organic uplift & effective cost per install (eCPI) | Organic uplift shows how paid campaigns indirectly boost organic installs by increasing brand visibility; a high uplift reduces eCPI. |
To maximise growth, invest in ASO to increase organic installs and complement it with targeted paid campaigns. Monitor your organic uplift to ensure that advertising spend yields long‑term benefits.
User feedback metrics
User sentiment affects both store algorithms and potential users’ perceptions. High ratings and detailed reviews improve your rankings and encourage others to install your app.
| Metric | What to track | Why |
| Rating score | Average star rating (1–5). | Higher ratings improve search ranking and signal quality; aim for 4 stars or above. |
| Number and recency of ratings | Quantity and freshness of ratings; recent ratings carry more weight in the algorithm. | Recent feedback reflects current user satisfaction and influences ranking. |
| Number and quality of reviews | Long, specific reviews and the ratio of ratings to reviews. | Detailed reviews are more persuasive than simple star ratings; a closer 1:1 ratio indicates engaged users. |
| User sentiment | Aggregate positivity/negativity from review texts. | Helps identify issues and informs product updates. |
Encourage satisfied users to leave ratings and reviews with in‑app prompts. Respond to negative reviews and integrate feedback into product improvements.
Monetization metrics
Ultimately, ASO should drive revenue. Monetization KPIs help you understand how effectively your app generates income.
| Metric | Definition | Use |
| Revenue | Total income from in‑app purchases, subscriptions, ads and one‑off payments. | Track revenue per traffic source to identify high‑value users and channels. |
| Average Revenue Per User (ARPU) | Total revenue divided by number of users. | Should exceed your user acquisition cost to ensure profitability. |
| Lifetime Value (LTV) | Predicted net profit a user will generate over their lifetime. | Align your acquisition and retention strategies to attract users with high LTV. |
In addition to these KPIs, consider tracking active users, lapsed users and retention rates. High retention indicates strong product-market fit; churn and re‑install metrics highlight opportunities to re‑engage users.
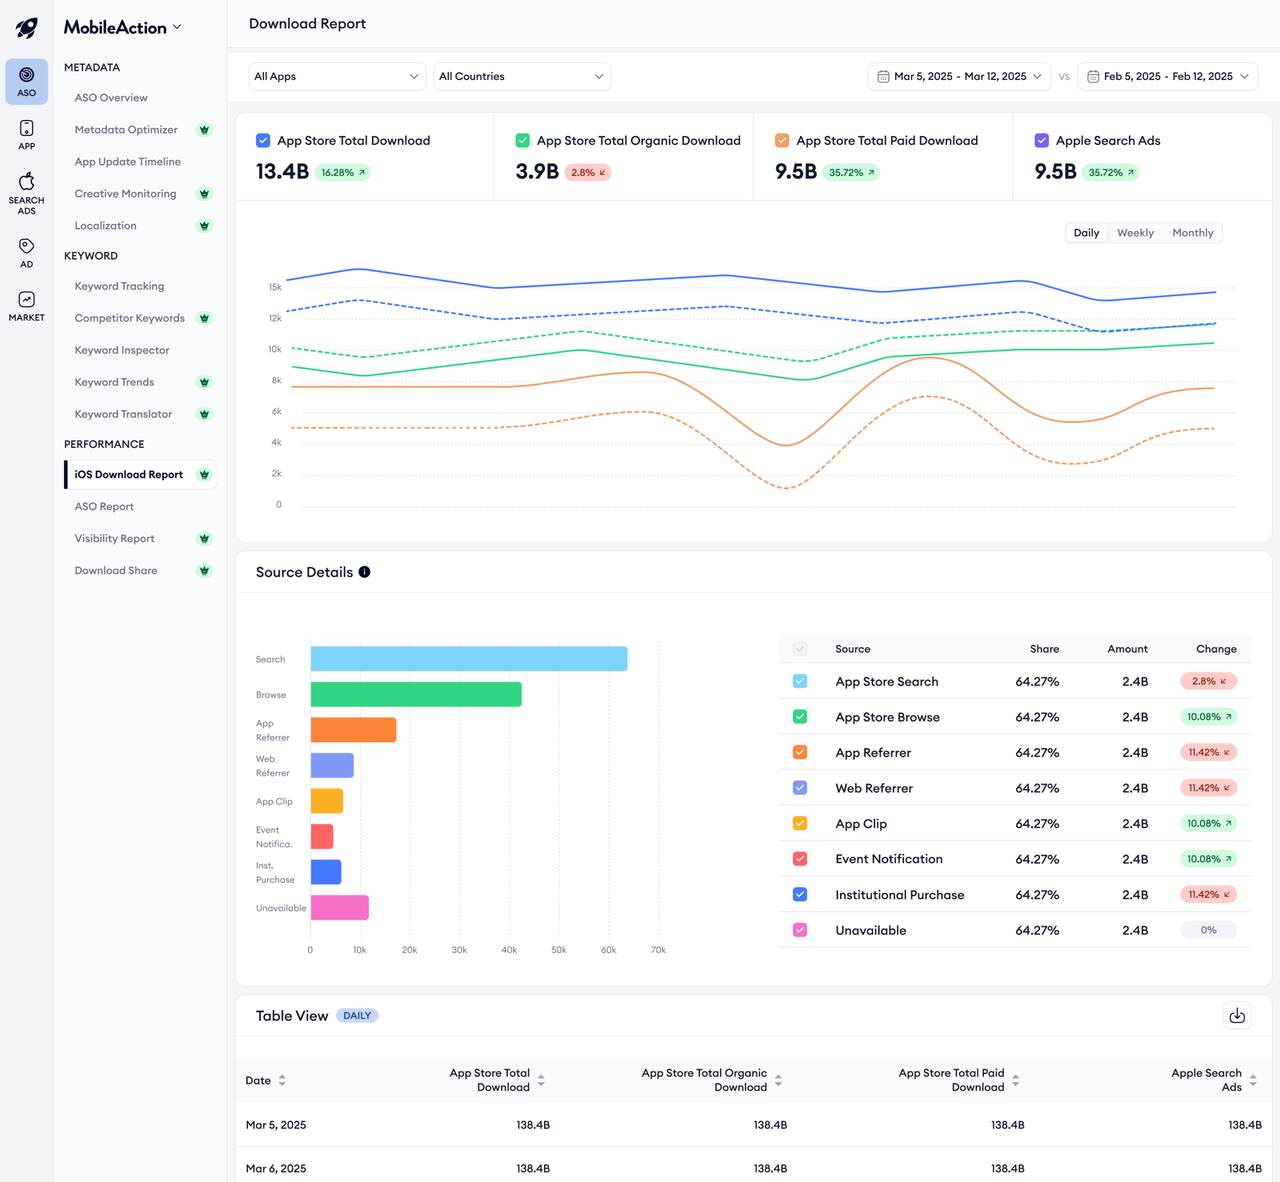
Traffic sources and platform differences
App Store and Google Play use different terminology and metrics. In the App Store, “impressions” count every time your app is displayed in the Today, Games, Apps or Search tabs.
Google Play doesn’t measure impressions; instead, it tracks store‑listing visitors (users who land on your listing). Similarly, conversion rates differ: Apple’s install rate divides installs by unique impressions, while Google’s conversion rate measures installs over store‑listing visitors.
Understanding these nuances prevents misinterpretation when comparing performance across platforms.
Traffic sources also affect conversion rates. Search traffic typically converts better than browse/explore traffic because searchers have higher intent. Web referrals, app referrals and ad campaigns may deliver lower conversion rates but can still contribute to overall growth.
Always segment KPIs by source to identify high‑performing channels.
Best practices for improving ASO KPIs
- Keyword research & optimization: Identify high‑volume keywords that reflect user intent and integrate them naturally into your app title, subtitle and description. Prioritise long‑tail keywords to capture niche queries with lower competition.
- Optimise metadata and creatives: Use compelling icons, screenshots and preview videos to highlight unique value propositions. Clear, concise descriptions that incorporate keywords help persuade users. Test different combinations via A/B testing tools like Google Experiments to find what resonates.
- Leverage social proof: Encourage happy users to leave ratings and reviews; respond promptly to negative feedback. Ratings and reviews influence rankings and conversion rates. Provide in‑app prompts at appropriate moments to request reviews without disrupting the user experience.
- Monitor traffic sources and conversion rates: Segment metrics by search, browse, referral and paid traffic to understand which channels deliver high‑intent users. Adjust keyword strategy or creatives based on where users come from.
- Measure growth holistically: Look beyond vanity metrics (e.g., cost per install or total downloads) because they can be misleading. Focus on active users, retention rates, organic uplift and LTV to gauge long‑term success.
- Iterate continuously: ASO is an ongoing process. User preferences, competitor tactics and store algorithms change over time. Regularly update your metadata, test new creatives and refine keyword strategy. Combine ASO with paid campaigns to boost visibility and organic growth.
Conclusion
Tracking the right ASO KPIs provides a data‑driven foundation for app growth.
Visibility metrics ensure that users can find your app; conversion metrics measure how well your listing persuades them to install; growth metrics reveal the sustainability of your acquisition efforts; user feedback metrics reflect sentiment and influence rankings; and monetisation metrics connect user behaviour to revenue.
By understanding platform differences and analysing traffic sources, you can make informed decisions and adapt your strategy. Above all, treat ASO as a continuous cycle of measurement, optimization and iteration.
Focusing on the metrics that matter—rather than vanity numbers—will help your app rise above competitors and achieve lasting success.
Your mobile app growth partner with intelligence, automation and expertise.