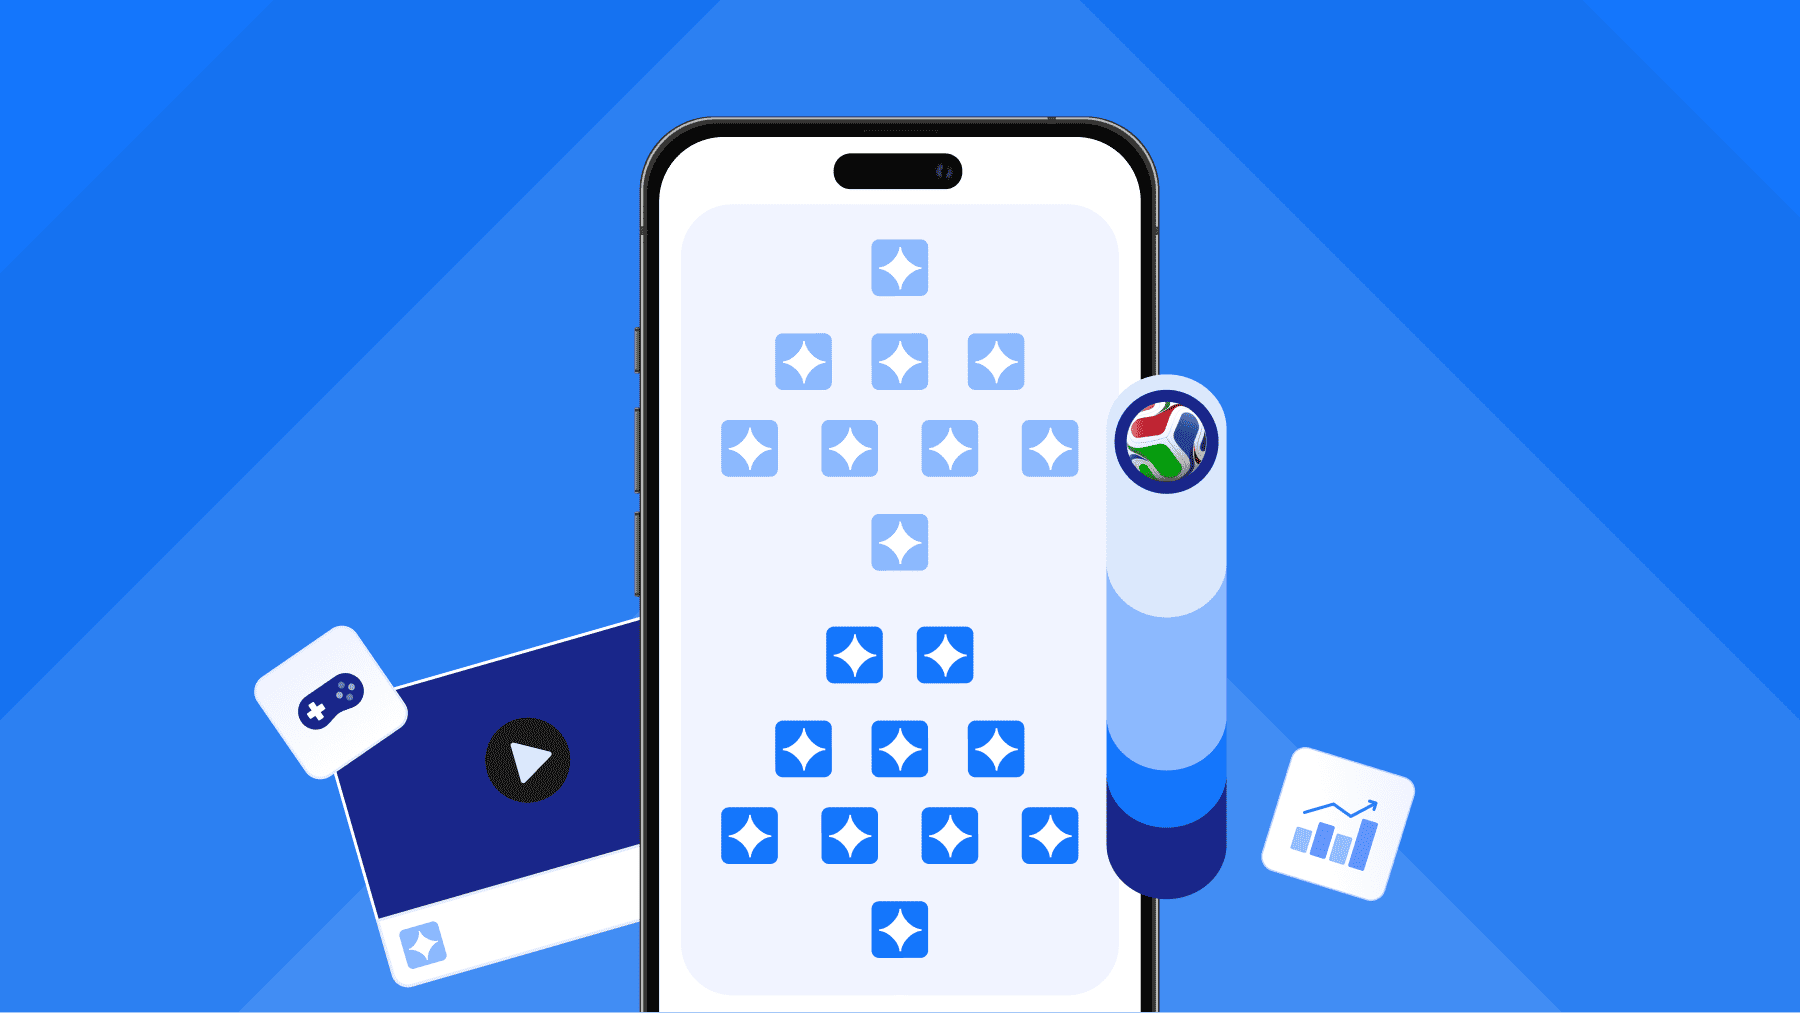


Apple Ads has updated two different parts of the measurement picture for app marketers.
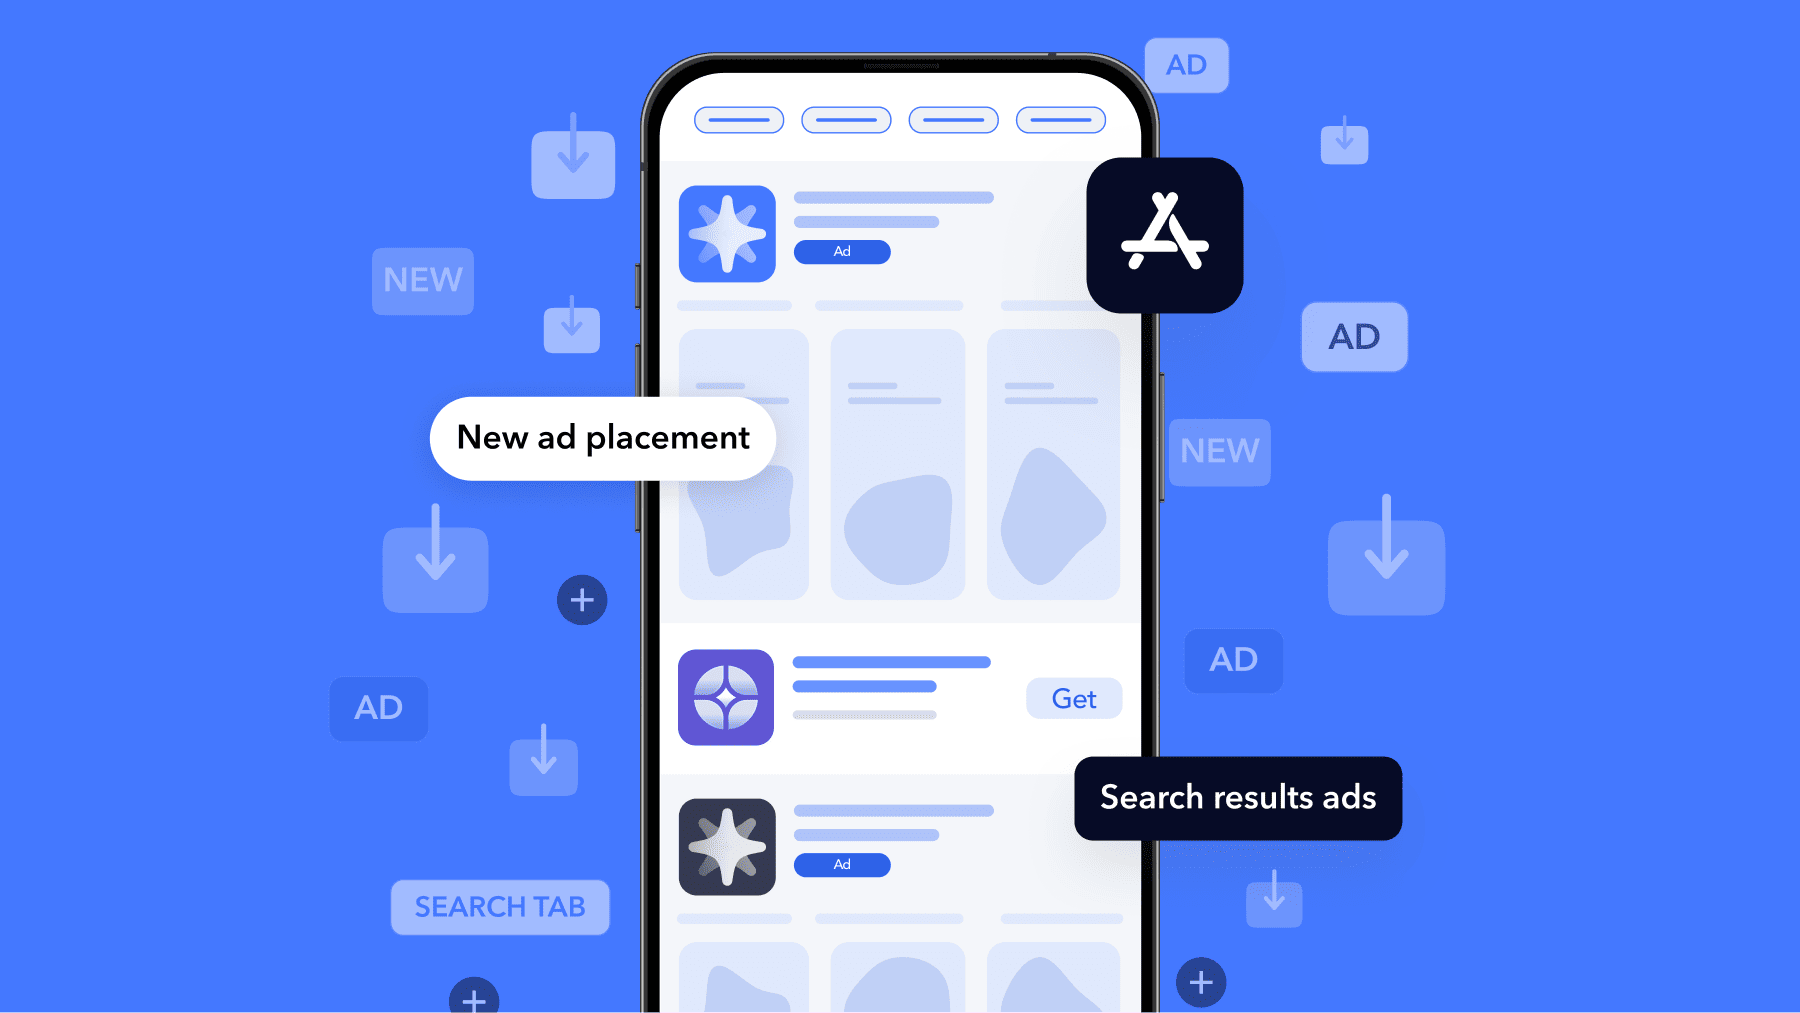
In Apple Ads, the Insights experience gives you a more flexible way to explore reporting across campaign groups, campaigns, ad placements, keywords, and other account dimensions.
In App Store Connect, Analytics now includes a broader set of monetization, subscription, cohort, and benchmarking capabilities that can help you understand what happens after acquisition.
Together, they can give you a clearer view of what each tool helps you measure. Below, we’ll cover what changed, what each update helps you do, where the boundaries are, and how to apply both in one practical workflow.
Apple Ads Insights: what it is and what it helps you do
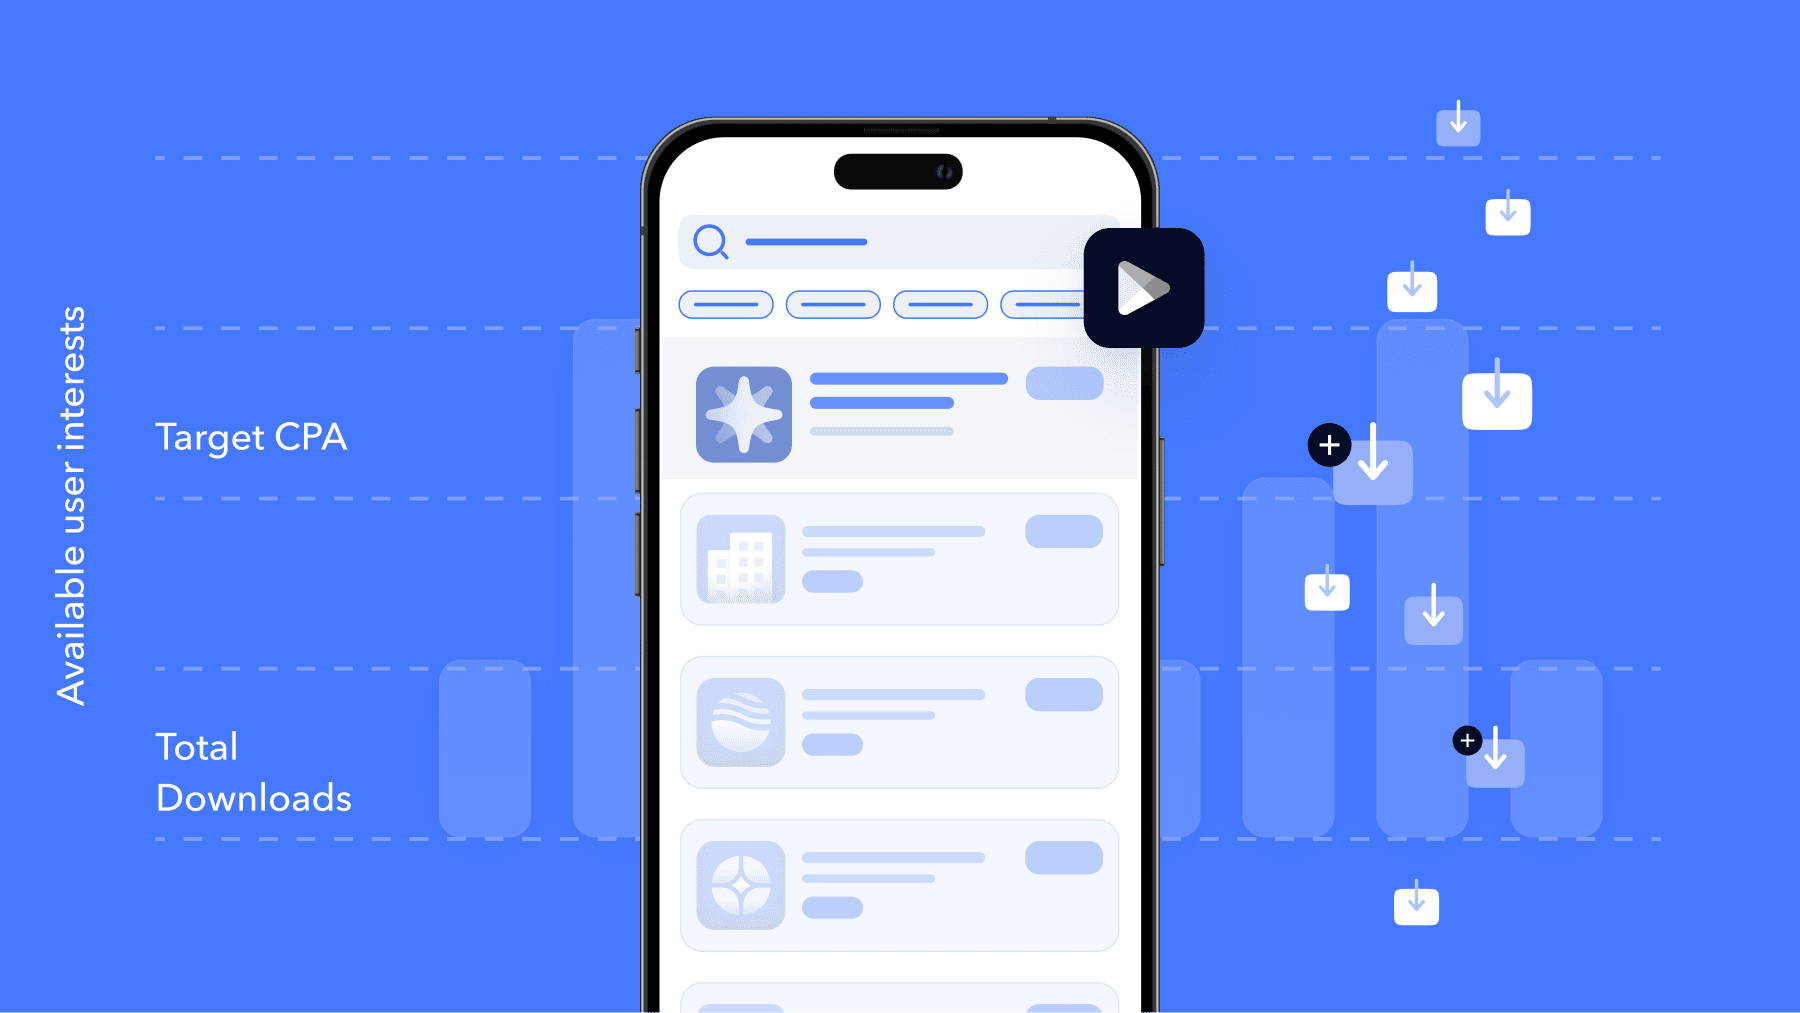
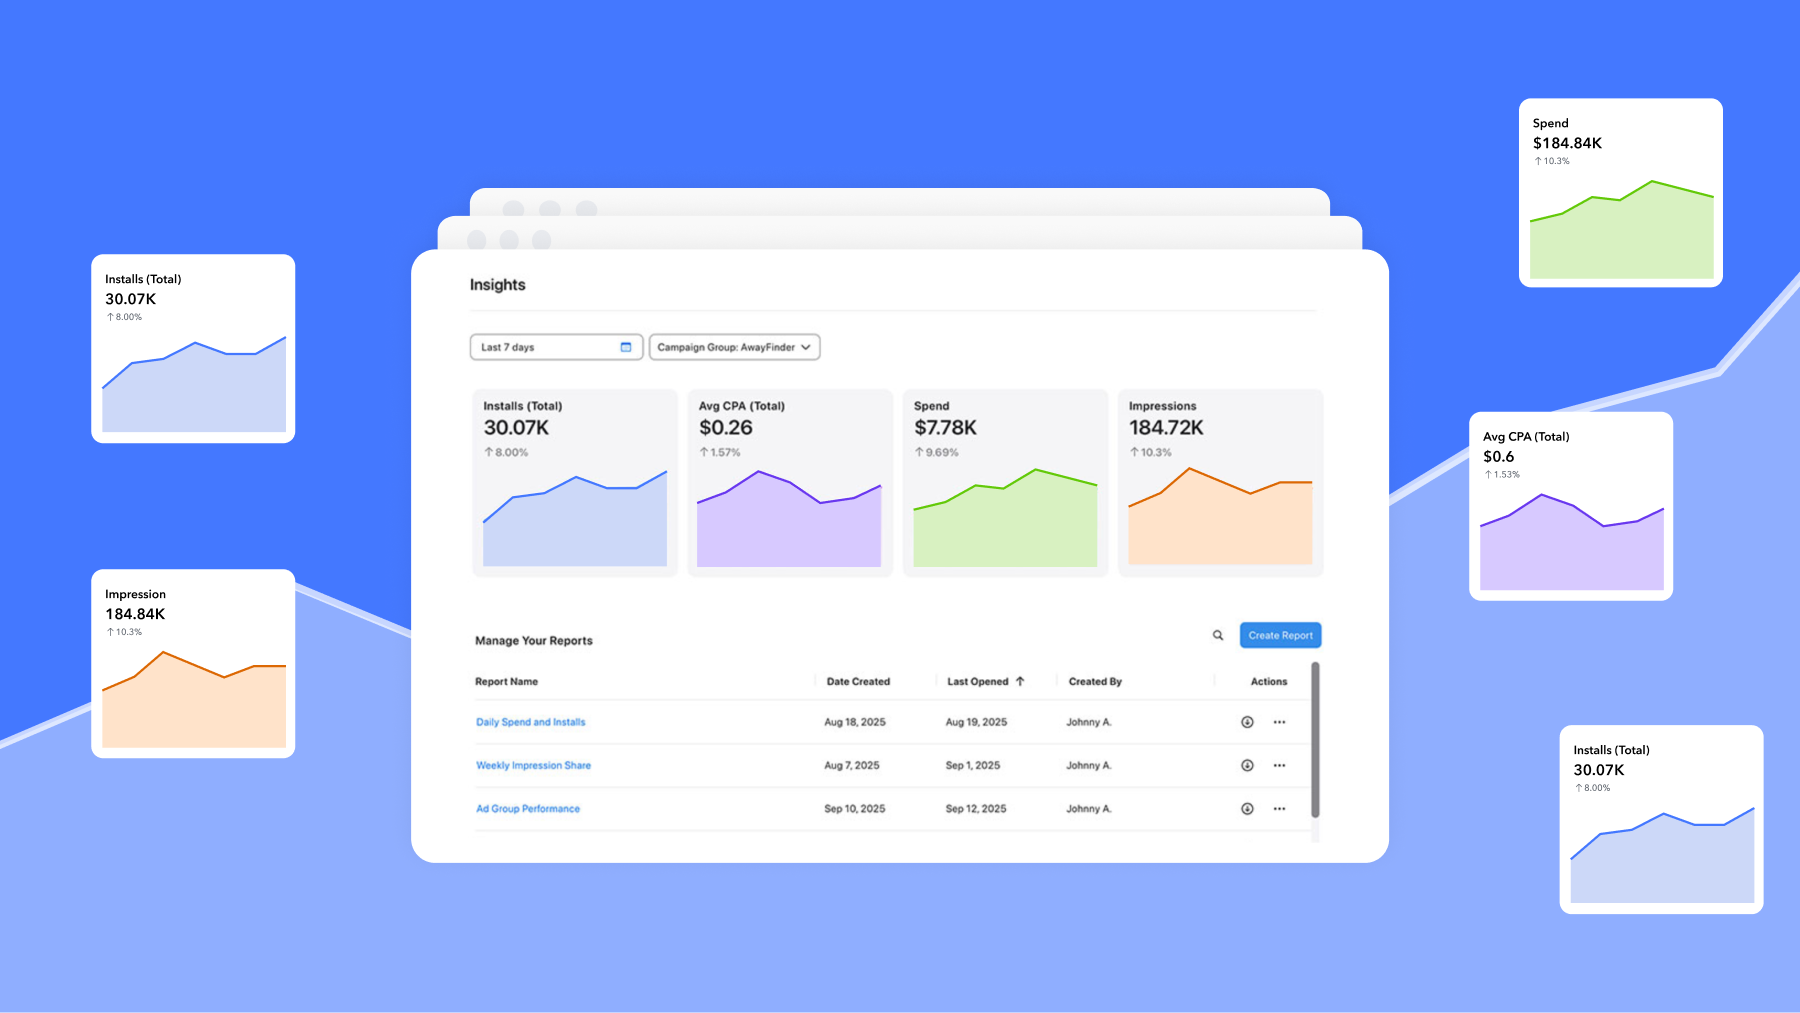
Insights is a data analytics workspace inside Apple Ads. According to Apple Ads, it’s designed to help you evaluate and compare performance across all dimensions in your account, including campaign groups, every campaign, ad placement, and keyword.
It has three main areas:
- Insights landing page, which provides a high-level performance snapshot for your selected campaign group
- Report builder, which offers predefined reports pre-populated with common metrics and dimensions
- Visualization options, which let you edit metrics, dimensions, and filters to view performance at the level of detail you need
For day-to-day use, Insights is where you go when you need to answer a specific performance question quickly: what’s driving a change in spend efficiency, which placements are contributing the most, which search terms are converting, or how performance compares across countries and regions.
Where to find Insights and what you’ll see first
You can access Insights from the upper-right corner of your Campaigns dashboard, Ad Groups dashboard, Ads dashboard, or Keywords tab by selecting the Insights link.
When you arrive, you’ll see a performance snapshot for your selected campaign group covering the last seven days by default. You can adjust the date range to view longer trends, and you can add or remove campaign groups to expand the view.
The landing page also shows your saved reports, including reports migrated from the Custom Report Builder and reports shared with you. If you sort by Last Opened, you can quickly find the reports you use most often.
✴️ Tip: You can set a consistent default view (a campaign group plus your preferred time range) so your weekly check starts from the same baseline.
Predefined reports: when to use Performance vs. Advanced
Predefined reports are the fastest way to get to useful data without building something from scratch. There are two types:
- Performance reports cover common views across your account structure: Campaign Groups, Campaigns, Ad Groups, Ads, Keywords, Search Terms, Ad Placements, and Country or Region. These reports help you see what’s working and what may need attention across your account.
- Advanced reports show aggregate views that aren’t always tied to a single campaign. Impression Share reports fall into this category. They can help you understand how competitive you are on particular search terms, including impression share, rank relative to other advertisers, and how popular a given search term is in a specific country or region.
These reports aren’t fixed. You can edit the metrics, dimensions, date range, and filters on most predefined reports. Some reports, especially Impression Share reports, have restrictions. For example, the timezone setting can’t be edited on certain predefined Impression Share reports.
✴️ Tip: You can use Performance reports when you’re making optimization decisions for your campaigns. Use Advanced/Impression Share reports when you need competitive context, such as before changing a bid or restructuring coverage for a search term.
Managing reports: saving, sharing, and downloading
Once you’ve set up reports you rely on, understanding how ownership and sharing work will save you some frustration.
Your Insights landing page shows three categories of reports: reports you created, reports that have been shared with you, and reports migrated from Custom Report Builder. You can see and sort these by name, creation date, and who created them.
- Editing: If you created a report, you can edit it and save changes. If a report belongs to someone else, any changes you make won’t persist unless you save it as your own version using Save as.
- Downloading: You can export any report as an XLSX file from the Actions column on the landing page. This is useful when you need to work with data offline or share it outside Apple Ads.
- Sharing: Reports are shared to campaign groups, not to individual people. Anyone with access to the campaign group gains access to the report automatically.
- Deleting: You can only delete reports you own. Deleting a report removes access for everyone it was shared with through that campaign group.
Insights considerations to keep in mind when building reports
There are a few report setup details in Insights that are helpful to know before you begin. Keeping these in mind upfront can make it easier to structure your report and get the view you need more efficiently.
- You can use one Time dimension per report.
- All reports support up to a 24-month date range.
- For Impression Share, Search Popularity, and Rank measures to display in a meaningful way, they should be paired with one of these dimensions: Day, App, App ID, Country or Region, or Search Term.
- Predefined Impression Share reports support up to 12 weeks of data.
- Some predefined report settings, such as the timezone on certain Impression Share reports, are fixed by report type.
When a report view does not appear as expected, it is often related to the selected dimensions or date range for that report type. Reviewing these setup details first can help you get to the right configuration more quickly.
App Store Connect Analytics: what’s new and what it unlocks
While Apple Ads Insights focuses on the paid side of your account, App Store Connect Analytics covers what happens on the App Store itself, how people find your app, whether they download it, and what they do after.
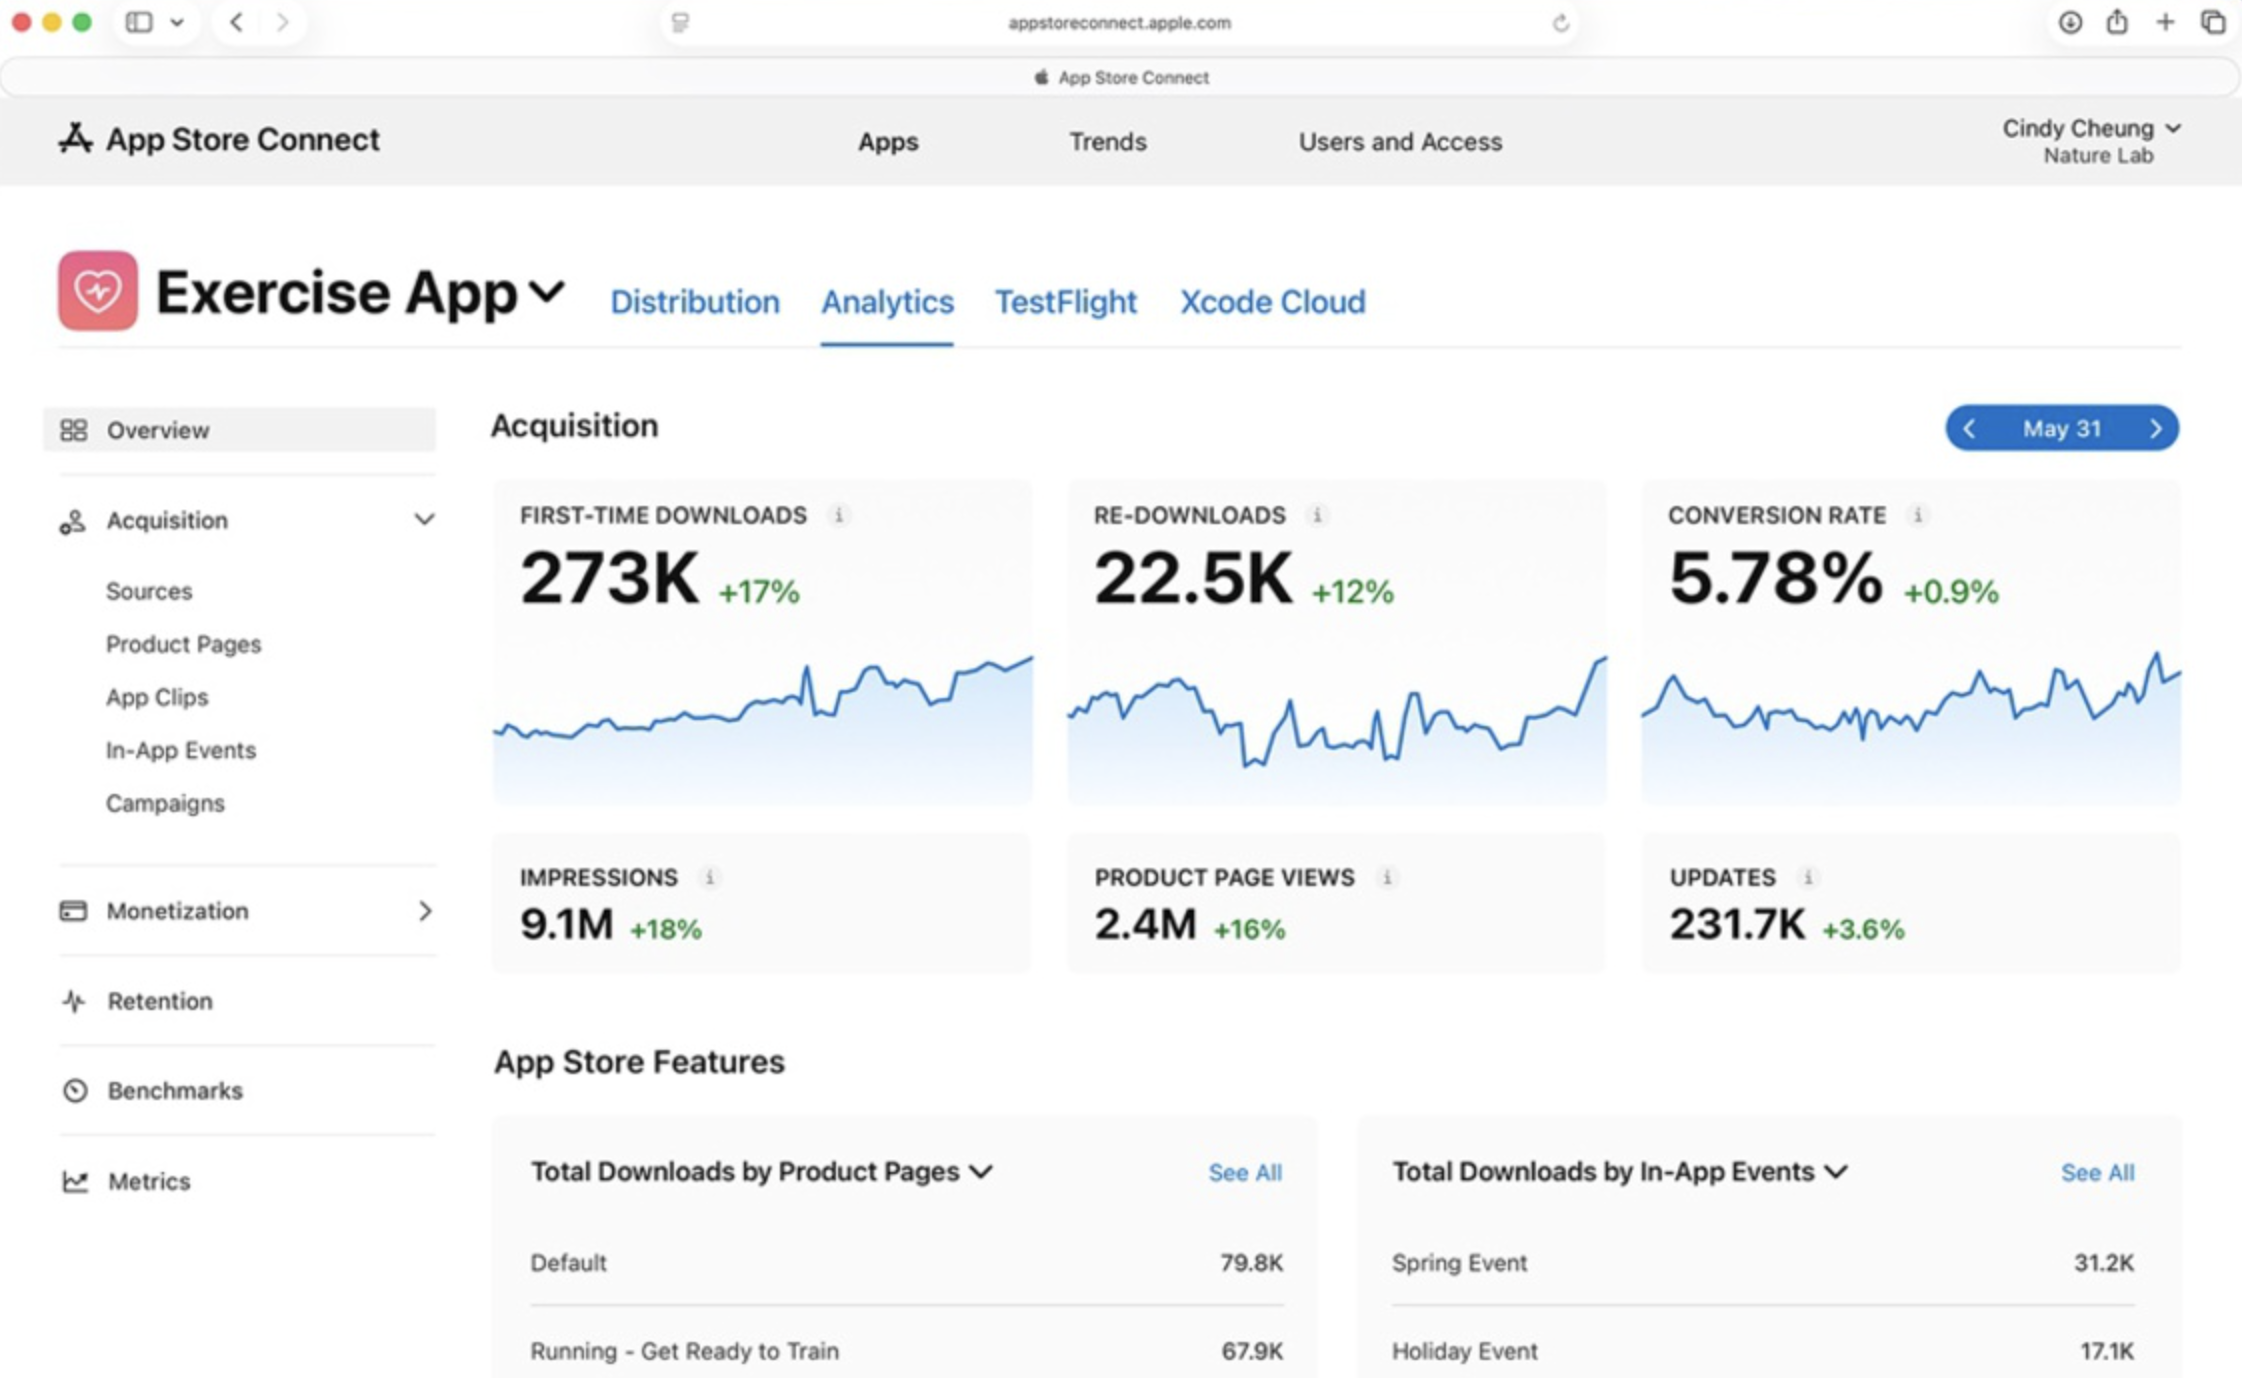
Apple Ads recently expanded App Store Connect Analytics in several meaningful ways:
- More than 100 new metrics. You now have access to monetization and subscription data directly within Analytics, covering the performance of your In-App Purchases and offers. Previously, getting a complete view of monetization performance required stitching together data from multiple places. This expansion brings more of that picture into one system.
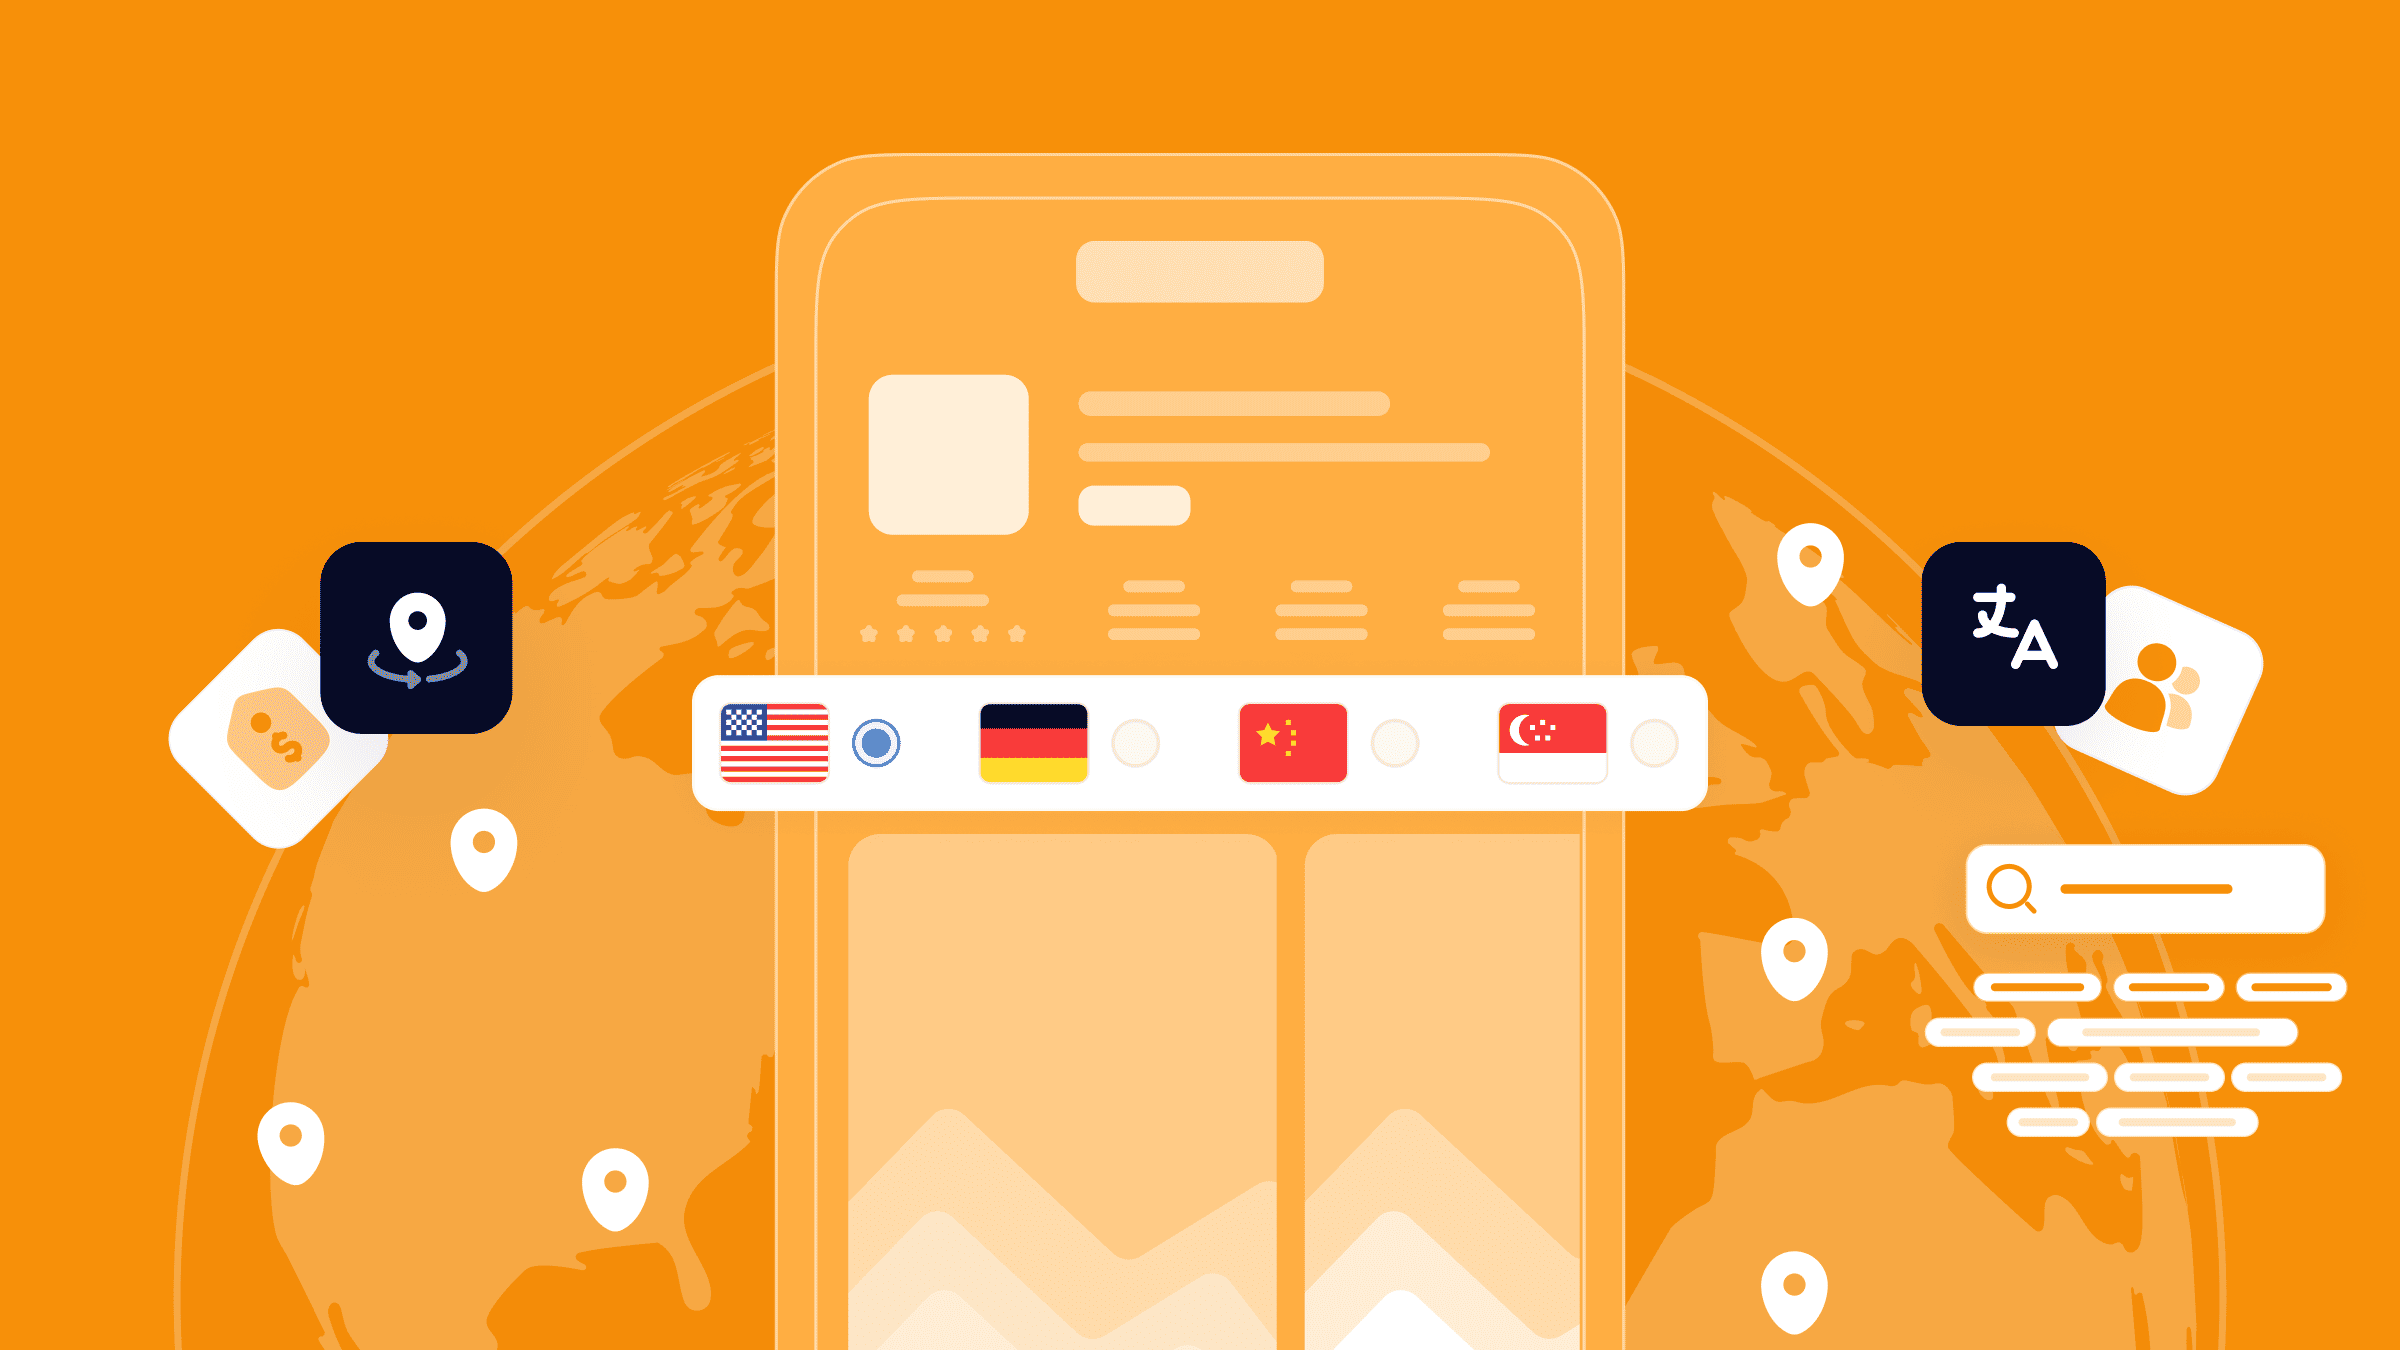
- New cohort capabilities. You can now analyze groups of users based on shared attributes, download date, download source, offer start date, and others, and track how those groups perform over time. For example, if you expanded your app to a new region, you can compare how long it takes users from that region to make a purchase compared to users from more established regions.
- New peer group benchmarks. App Store Connect Analytics now includes two monetization-specific benchmarks: download-to-paid conversion and proceeds per download. These benchmarks let you compare your monetization performance against similar apps using data from across the App Store catalog.
- Two new subscription reports. These reports can be exported via the Analytics Reports API for offline analysis or to integrate subscription data into your own systems.
- Additional filters. You can now apply up to seven filters simultaneously to your selected metrics, which lets you drill into much more specific segments without needing to run separate queries.
This expands Analytics beyond a narrower top-line performance view. It gives marketers more ways to understand not just whether users arrived, but how different groups perform over time and how business outcomes develop after acquisition.
What these Analytics updates help you understand beyond installs
Before you start drawing conclusions from the new metrics, particularly cohorts, benchmarks, and engagement data, it’s worth understanding what the data actually includes and where the limits are.
- On acquisition metrics: Total Downloads combines First-Time Downloads and Redownloads. Conversion rate is calculated as total downloads divided by unique impressions. Both are meaningful, but they measure different things, and it helps to be deliberate about which one you’re using for a given decision.
- On engagement data: Active device and session metrics only include users who have agreed to share their diagnostics and usage information with you. This means your engagement figures reflect an opted-in subset of your actual user base, not everyone who has the app installed.
- On privacy thresholds: Certain acquisition sources, app referrers, web referrers, and campaign links, require a minimum amount of data before they appear in Analytics. If you’re not seeing a particular source, it may be below the threshold, not absent entirely. These privacy protections apply throughout Analytics, including subscription and cohort views.
- On peer group benchmarks: Benchmark values are generated using differential privacy, which is Apple Ads’s approach to ensuring individual app performance within a peer group remains protected. Peer group benchmarks also only include data from users who have agreed to share their app analytics.
Before you make a significant change based on a metric, especially a new one you haven’t used before, confirm what that metric includes, what it excludes, and whether privacy thresholds could be affecting what you’re seeing.
How MobileAction helps you operationalize Apple Ads Insights
Apple Ads Insights and App Store Connect Analytics help you analyze and interpret performance inside Apple Ads’s environments. MobileAction helps you apply what you learn across your Apple Ads account in a consistent, scalable way, without assuming any direct connection between Apple Ads’s tools.
When Insights helps you spot where performance is shifting (by campaign group, placement, keyword/search term, or country/region), MobileAction helps you operate on those findings through centralized management and bulk actions (Ads Manager), plus repeatable optimization and monitoring workflows.
When App Store Connect Analytics helps you validate store outcomes (acquisition sources, conversion rate trends, retention, monetization/subscription visibility, cohorts, and peer benchmarks, within Apple Ads’s privacy rules), you can use those learnings to prioritize what to change on the Apple Ads side (for example, which segments to scale, which to refine, and which hypotheses to test).
If you rely on downstream outcomes beyond installs, MobileAction can also support your measurement stack by connecting your MMP in Attribution and defining Goals based on in-app events.
Content Marketing Specialist